[Technical Report] Analytical Method of Neonicotinoid Pesticides using STQ Method
This article was written by Mr. Kenji Konishi, AiSTI SCIENCE Co., Ltd., Technical & Marketing Group, for Vol. 15 (February 2021), of ChemGrowing.
The content of this article is from the time of publication. It is not the latest information due to new knowledge and changes in regulatory rules after original publication.
Introduction
While neonicotinoid pesticides are used in many countries, partial restrictions on their use exist in certain countries (including the EU). Neonicotinoid pesticidesare said to be one of the causes for colony collapse disorder of honey bees. There is no restriction on use in Japan, therefore, there is a high demand for analysis. In this article, we introduce how to optimize the neonicotinoid pesticides analyses by applying STQ*-LC method, which is a "rapid, simple and highly purified" pesticide residue analysis method.
*STQ method: Solid Phase Extraction Technique with QuEChERS method
Outline of STQ-LC Method
The outline of STQ-LC method is shown in Figure 1.
The STQ method is a "rapid, simple and highly purified" analytical method that takes into account the total balance from homogenization of samples to analysis.
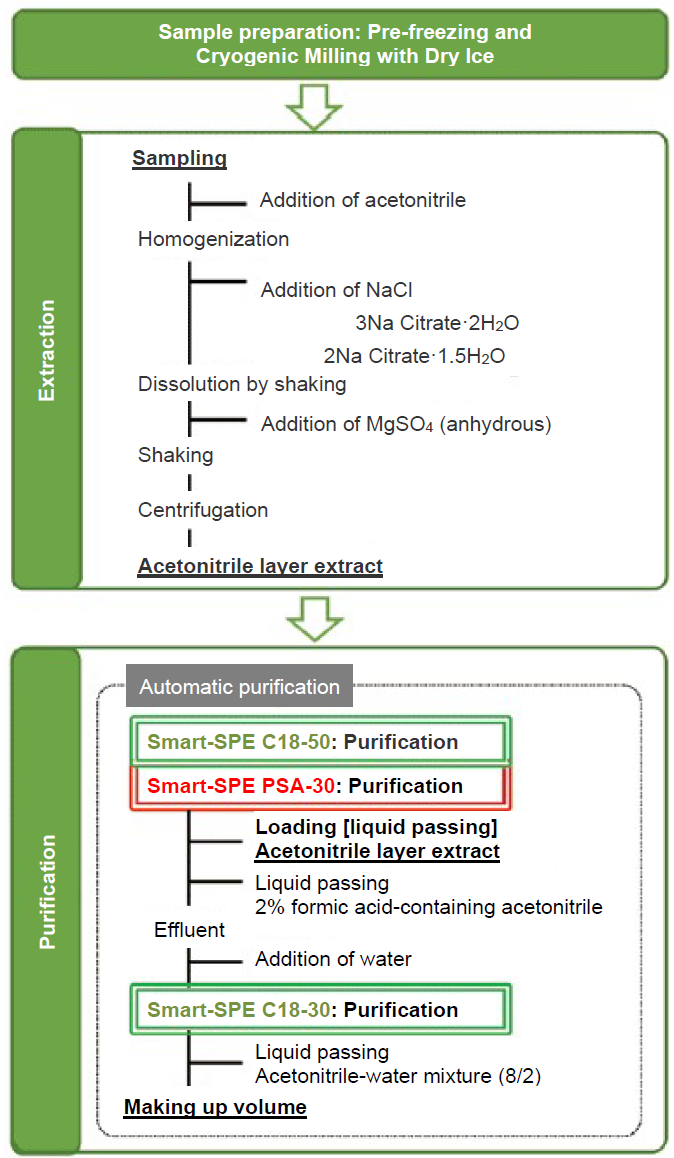
Figure 1. Outline of STQ-LC Method
The sample is prepared by pre-freezing and cryogenic milling with dry ice. It is then homogenized and extracted (using acetonitrile, salting-out and liquid-liquid partition) according to the QuEChERS method, the sample is then purified using a solid phase cartridge Smart-SPE with a small filling amount of several tens of mg.
The STQ-LC method is a purification method that targets relatively high-polar compounds measured by LC-MS/MS. In the basic flow, the sample (extract) is loaded to connected C18 and PSA to eliminate non-polar and low-polar impurities with C18 and longer chain fatty acids and ionic impurities with PSA. Since acidic pesticides having a carboxyl group (-COOH) are adsorbed to PSA, these compounds are eluted by passing acetonitrile acidified with formic acid.
Then, water is added to the effluent from C18 and PSA to lower the solvent ratio, and the solution is passed again through another C18 to remove low polarity impurities that were not completely removed by the first C18. The burden on the analytical column (ODS) can be reduced by removing non- and low-polar impurities in this way (Figure 2). Sufficient purification can prevent degradation of analytical columns, maintain peak shapes, and shorten the column washing time. In this experiment, we demonstrate how to optimize neonicotinoid pesticide analysis using this method.
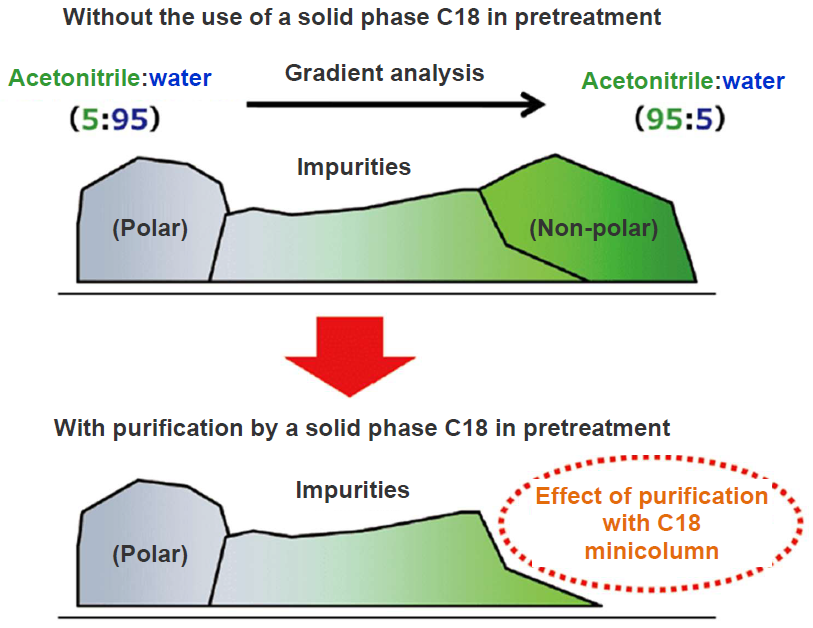
Figure 2. Removal of Non-polar Impurities by LC Separation Column
Analytical Method
Analytical Samples
Honey, brown rice, soybean, spinach, tea
Standard Solutions
Neonicotinoid Pesticide Mixture Standard Solutions (FUJIFILM Wako, Code Nos. 149-09461, 145-09463).
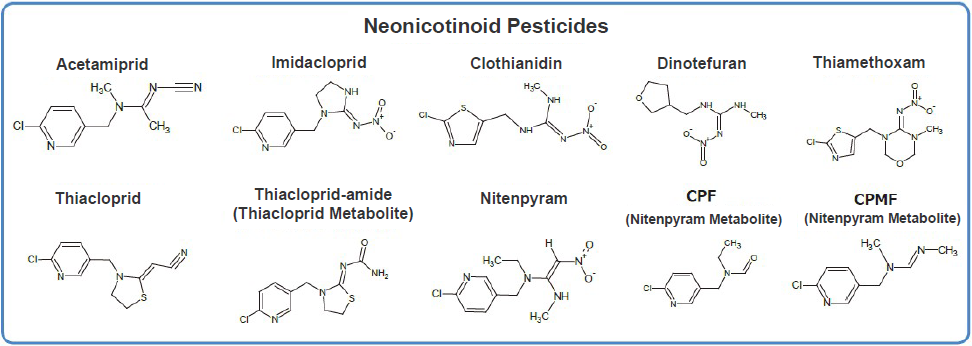
Figure 3. Neonicotinoid Pesticides
Preparation of Samples
Homogenization of samples is important for maintaining analytical precision. The pre-freezing and cryogenic milling with dry ice preparation method used in the STQ protocol homogenizes a sample to a powder by grinding the sample, which has been pre-frozen on dry ice, together with dry ice. Not only vegetables such as spinach but also grains and beans such as brown rice and soybeans were ground more finely than milling at room temperature and homogenized (Figure 4). As grinding in frozen state also suppresses enzyme activities, it is also useful for grinding samples producing allyl compounds by enzyme activities. In the present recovery test, spinach, brown rice and soybeans were ground by the pre-freezing and cryogenic milling with dry ice method using a large volume freeze crusher (Figure 5). Tea was pulverized by a mill and homogenized.
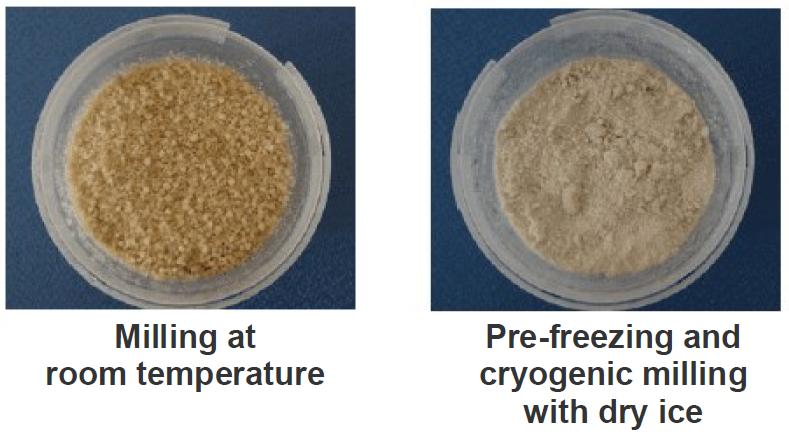
Figure 4. Comparison between Milling at Room Temperature and Pre-freezing and Cryogenic Milling with Dry Ice (Brown Rice)
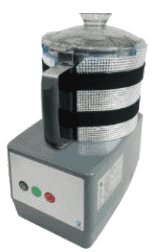
Figure 5. Large Volume Freeze Crusher (Code No. 387-17711)
Extraction
The extraction flow is shown in Figure 6.
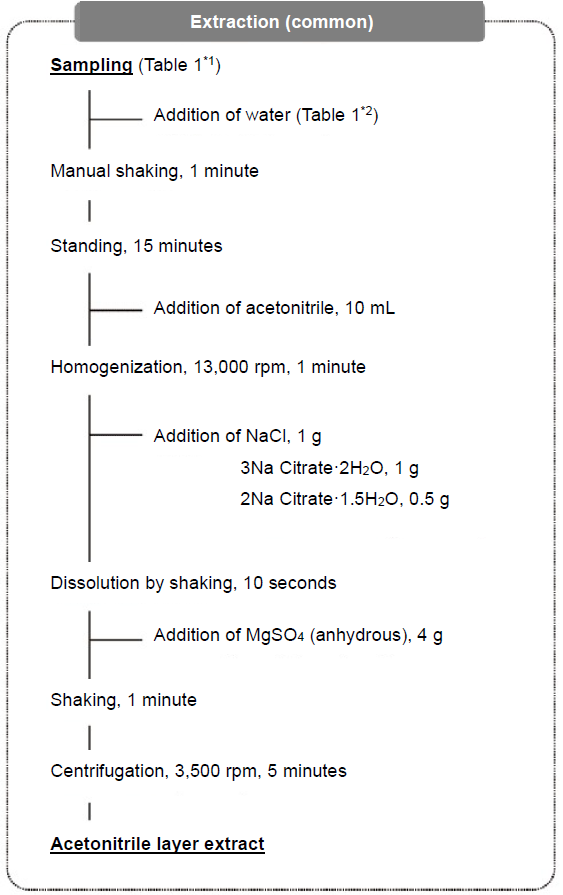
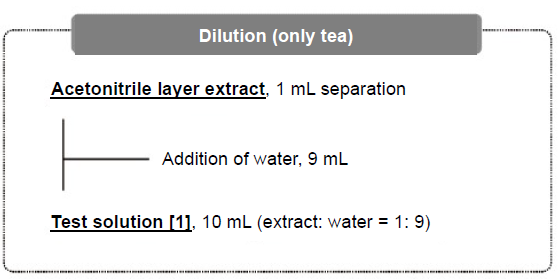
Figure 6. Extraction Flow
The samples were weighed according to the description as shown in Table 1, and the mixture standard solution was added to make honey, brown rice, soybeans and spinach 0.01 ppm and tea 0.25 ppm in the samples.
Table 1. Amount of Sample and Amount of Water Added
| Analytical samples | *1 | *2 |
|---|---|---|
| Amount (g) of sample | Amount (mL) of water added | |
| Honey | 5 | 10 |
| Brown rice | 5 | 10 |
| Soybean | 5 | 10 |
| Spinach | 10 | - |
| Tea | 2 | 10 |
Then, 10 g of purified was added to the samples (honey, brown rice, soybean and tea have water content less than 80%), mixed by shaking, and allowed to stand for 15 minutes to swell. As the extracting solvent, 10 mL of acetonitrile was added and homogenized for 1 minute. Then, 1 g of sodium chloride, 1 g of trisodium citrate dihydrate, and 0.5 g of disodium citrate 1.5 hydrate were added and shaken to dissolve the reagents: subsequently, 4 g of anhydrous magnesium sulfate was added, and the entire mixture was shaken vigorously by hand for 1 minute. Sodium chloride and anhydrous magnesium sulfate were used for liquid-liquid partitioning by the salting-out effect, and trisodium citrate dihydrate and disodium citrate 1.5 hydrate were used as buffers. By adding anhydrous magnesium sulfate after dissolving three salts once instead of adding all four salts simultaneously, lumping of anhydrous magnesium sulfate by absorption of water was reduced. Then, the solution was centrifuged and the upper acetonitrile layer was used as the extract. The test solution of tea was prepared by diluting its extract 10 times with water to reduce the matrix.
Purification
Purification was performed by the fully automated solid phase extraction system ST-L400 (Figure 7) using a total of 3 solid-phase columns comprising of Smart-SPE PBX*-20 (2 units) and PSA-30 (1 unit).
*PBX: Polymeric hydrophile-lipophile balance filler
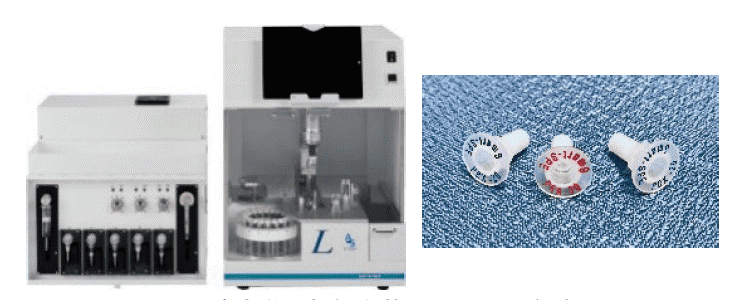
Figure 7. Fully Automated Solid-phase Extraction System ST-L400 (left) and Solid-phase Column Smart-SPE (right)
The purification flow is shown in Figure 8.
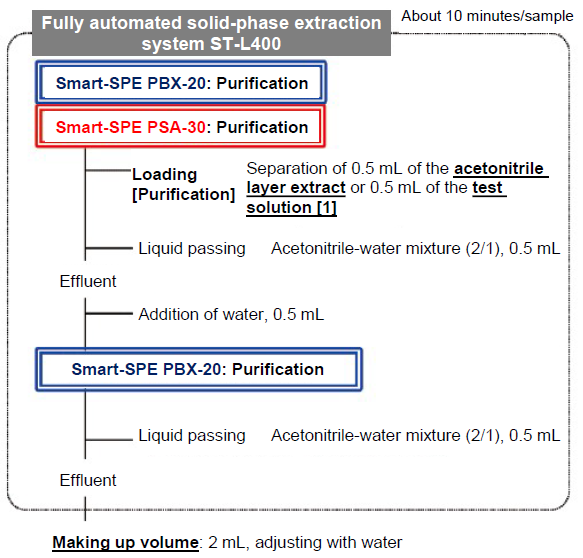
Figure 8. Purification Flow
Non-polar and low-polar impurities such as pigments and lipids are removed with PBX, which is a polymeric hydrophile-lipophile balance filler. Then, acidic substances such as fatty acids and anionic impurities are removed with PSA. By adding water to the effluent from the connected column, the ratio of acetonitrile is reduced and low-polar impurities that were not completely removed with the above PBX are eliminated. As neonicotinoid pesticides to be analyzed are not retained in the solid phase, the effluent is received in a test tube. Target components are eluted completely by passing the acetonitrile-water mixture (2/1) through the lower PBX. The effluent is received in the same test tube, made up the volume with water and is used as the measurement solution.
When C18 adopted in the STQ-LC method is used, CPMF, one of the target components, is adsorbed requiring an acidic solvent for elution. However, with PBX, CPMF is not adsorbed and, thus, a neutral solvent can be used. As the STQ method targets a wide range of pesticide components, an acidic solvent is used to elute acidic pesticides that are adsorbed to PSA, but this results in elution of some ionic impurities. Since all of the neonicotinoid pesticides subject to analysis this time are not retained in PSA, the liquid passing after loading can recover the target components without eluting anionic impurities adsorbed to PSA by using a neutral acetonitrile-water mixture.
The solid-phase extraction (purification) process using the fully automated solid-phase extraction system ST-L400 is outlined in Figure 9.
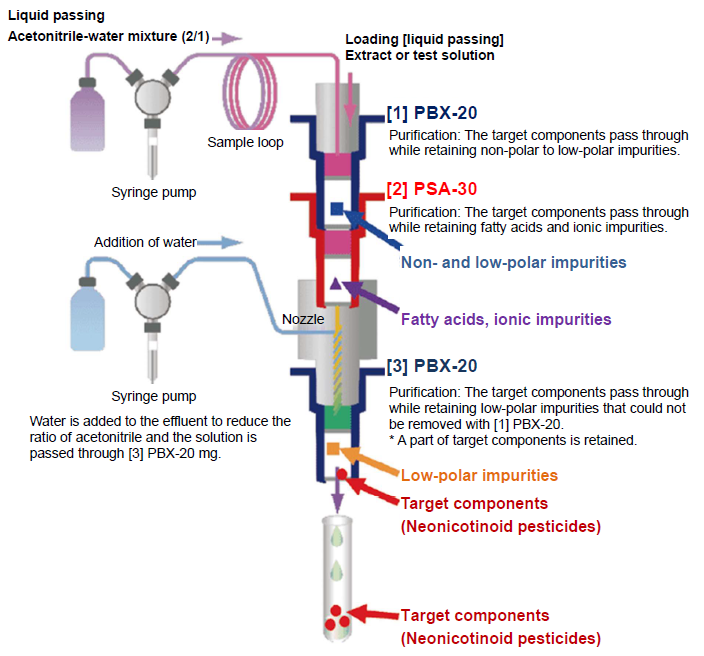
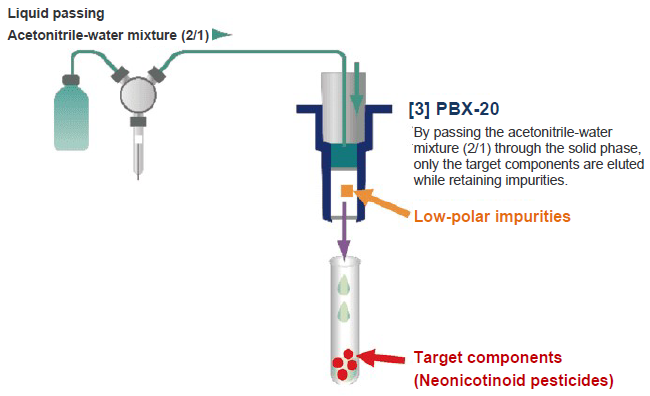
Figure 9. Purification Process with Fully Automated Solid-phase Extraction System ST-L400
0.5 mL of the extract (test solution in the case of tea) obtained in section 3-4 was loaded to the connection port between PBX-20 (upper) and PSA-30, and 0.5 mL of acetonitrile-water mixture (2/1) was passed through the column. To the effluents from PBX-20 (upper) and PSA-30, 0.5 mL of purified water was added and passed through PBX-20 (lower). Then, 0.5 mL of an acetonitrile-water mixture (2/1) was passed to elute the target components from PBX-20. The effluents were all received in a test tube and purified water was added to make a total volume of 2 mL.
Measuring Conditions
The samples obtained were measured by LC-MS/MS. The measurement conditions are shown in Table 2. The peak shape of CPMF was improved by adding formic acid to the mobile phase and making it acidic (Figure 10). Gradient analysis using the mobile phase with the composition of B Conc. 5% at the start of measurement (at the time of sample injection) provided favorable peak shapes in all components (Figure 11).
Table 2. Measuring Conditions
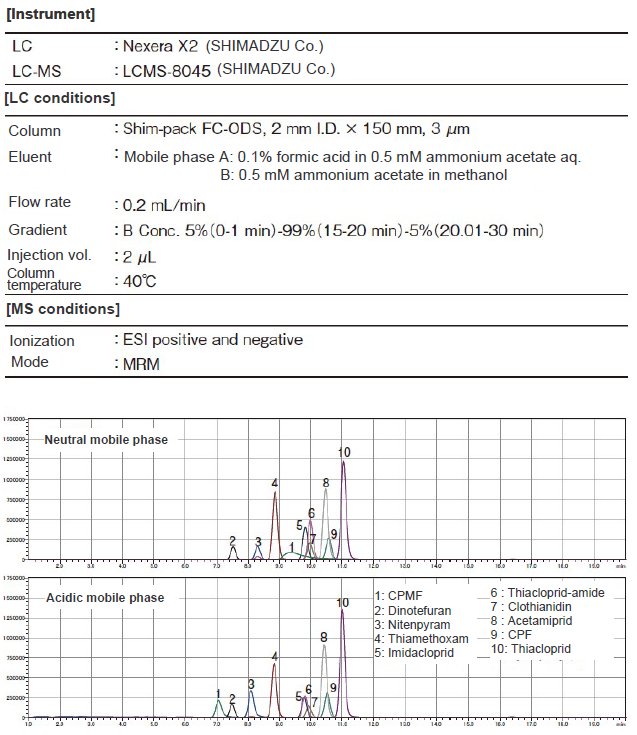
Figure 10. Comparison of Peak Shapes Depending On pH of Mobile Phase (upper: neutral mobile phase, lower: acidic mobile phase)
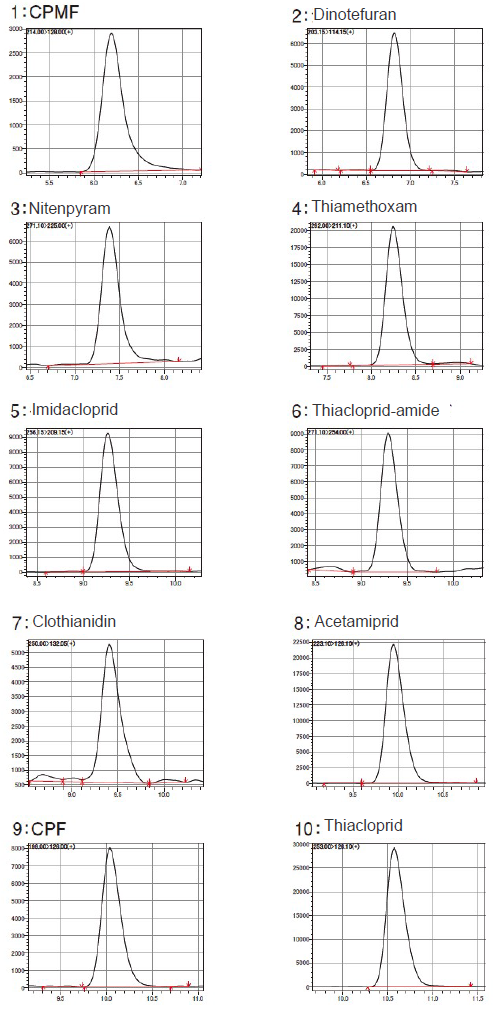
Figure 11. Chromatogram of Each Component (standard solution 1.25 ppb)
Results
The results of the recovery test of the target components are shown in Table 3. The recovery rate was calculated by comparing the peak area of each component in the recovery test sample with that from the standard solution at the same concentration. The concentration of the recovery test sample in the vial was 2.5 ppb with spinach and 1.25 ppb with others.
Calculation formula of recovery rate (%)
Area from the recovery sample / area from the standard solution x 100
Table 3. Recovery Test Results
(n=5)
| Component name | RT (min) |
Polarity | Honey | Brown rice | Soybean | Spinach | Tea | |||||
|---|---|---|---|---|---|---|---|---|---|---|---|---|
| 0.1 ppm in sample | 0.1 ppm in sample | 0.1 ppm in sample | 0.1 ppm in sample | 0.1 ppm in sample | ||||||||
| 1.25 ppb in vial | 1.25 ppb in vial | 1.25 ppb in vial | 1.25 ppb in vial | 1.25 ppb in vial | ||||||||
| Recovery rate (%) |
RSD (%) |
Recovery rate (%) |
RSD (%) |
Recovery rate (%) |
RSD (%) |
Recovery rate (%) |
RSD (%) |
Recovery rate (%) |
RSD (%) |
|||
| CPMF | 6.2 | (+) | 104 | 1.3 | 115 | 5.4 | 105 | 5.5 | 108 | 2.3 | 111 | 1.8 |
| Dinotefuran | 6.8 | (+) | 102 | 1.8 | 91 | 4.0 | 96 | 3.6 | 94 | 3.8 | 75 | 3.8 |
| Nitenpyram | 7.4 | (+) | 95 | 4.6 | 86 | 3.1 | 90 | 5.1 | 94 | 2.8 | 113 | 9.0 |
| Thiamethoxam | 8.3 | (+) | 105 | 0.8 | 90 | 1.5 | 107 | 1.4 | 97 | 2.1 | 81 | 2.6 |
| Imidacloprid | 9.3 | (+) | 104 | 3.1 | 92 | 3.1 | 102 | 3.5 | 140※ | 31.9 | 85 | 3.5 |
| Thiaclopridamide | 9.3 | (+) | 100 | 1.8 | 95 | 3.0 | 111 | 2.9 | 110 | 1.8 | 108 | 2.3 |
| Clothianidin | 9.4 | (+) | 54 | 6.3 | 82 | 3.7 | 77 | 8.3 | 99 | 3.6 | 67 | 4.1 |
| (-) | 105 | 8.3 | 77 | 15.3 | 100 | 14.6 | 106 | 12.3 | 52 | 12.0 | ||
| Flupyradifurone | 10.6 | (+) | 92 | 3.2 | 90 | 2.1 | 94 | 4.7 | 116 | 4.3 | 92 | 3.3 |
| Acetamiprid | 10.0 | (+) | 102 | 1.5 | 90 | 2.8 | 93 | 4.8 | 99 | 2.4 | 92 | 0.9 |
| CPF | 10.1 | (+) | 107 | 3.0 | 73 | 4.3 | 92 | 4.9 | 108 | 4.6 | 83 | 2.4 |
| Thiacloprid | 10.6 | (+) | 103 | 1.5 | 87 | 0.7 | 94 | 4.9 | 100 | 2.7 | 85 | 1.3 |
*Detected about 10 times the added concentration from the unknown sample (presented as a value after subtraction)
Except for imidacloprid in spinach and clothianidin in tea, good results were obtained with recovery rate of 70% to 120% and repeatability within 10%.
For spinach, the recovery rates were not evaluated accurately because imidacloprid was detected exceeding the concentration added from the analytical sample. Because clothianidin was susceptible to the influence of ionization inhibition regardless of the sample, the measurement was performed in both the positive and negative measurement modes and good recovery rates were obtained in either mode with the samples other than tea. However, the recovery rates were low in both modes with tea. For the components other than clothianidin in tea, the extract was diluted 10 times and purified by solid phase extraction and thereby catechins were removed and ionization inhibition was reduced (Figure 12).
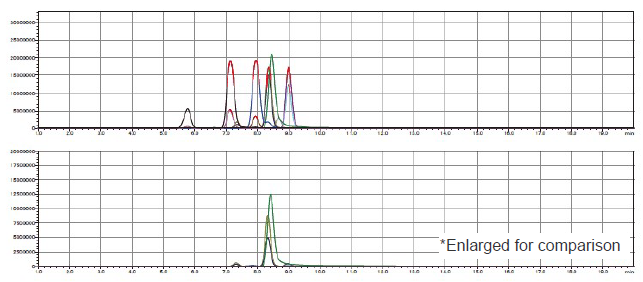
Figure 12. TIC Chromatogram of Tea Extract (upper: equivalent to 0.033 g of sample, lower: equivalent to 0.01 g of sample)
In this pretreatment, a good recovery rate was also obtained for CPMF by changing C18 in the basic flow to PBX. For liquid passing, an acetonitrile-water mixture (2/1) was used to suppress the elution of non-polar and low-polar impurities and elute only the target components.
Conclusions
The peak shapes of CPMF and dinotefuran were improved by using an acidic mobile phase for the separation of 10 neonicotinoid pesticides by LC and making the mobile phase composition as B Conc. 5% at the start of analysis.
In addition, in the optimization from STQ-LC method to neonicotinoid pesticide analysis, it was possible to improve the recovery rate and purification effect by changing C18 adopted in the basic flow to PBX, using an acetonitrile-water mixture (2/1) as the passing liquid, and diluting the extract with water in the case of tea. As a result, good recovery rates and reproducibility were obtained. In this study, we proposed pretreatment methods for neonicotinoid pesticides, and demonstrated that they could be analyzed quickly, easily, and in highly purified manner for the respective samples.
References
- Konishi K. et al.: Proceedings of the 37th Meeting of the Pesticide Science Society of Japan, p119 (2014).
- Sasano R. et al.: Proceedings of the 106th Meeting of the Japanese Society for Food Hygiene and Safety, p115 (2013).
- Hirai C. and Yamagishi H.: Annual Report of Fukui Prefectural Institute of Public Health and Environmental Science, Vol. 14, p32 (2015).
- Konishi K. et al.: Proceedings of the 43rd Meeting of the Pesticide Science Society of Japan, p163 (2020).