Es-Eapp Plot
This article was written by Dr. Masakazu Tsuchiya, FUJIFILM Wako Pure Chemical Corporation, for Vol. 63, No.2 (April 1995) of Wako Junyaku Jiho.
The content of this article is from the time of publication. It is not the latest information due to new knowledge and changes in regulatory rules after original publication.
It is important to understand how a sample may affect the results of the LAL test. A sample used in an inhibition test may also contain endotoxin, which could reduce the accuracy of endotoxin recovery and make it difficult to measure how the sample might affect the measurement.
In this article, I would like to introduce a method that we developed to simultaneously estimate the degree of interference that a sample would have on the measurement, as well as, the concentration of endotoxin contained in the sample. We call this method the Es-Eapp plot 1,2).
Let me first explain how to construct an Es-Eapp plot. Frist, sample solutions are prepared by adding endotoxin at various concentrations, normally by a series of 2-fold dilutions. These solutions are then analyzed by a Toxinometer® to measure the apparent concentration of endotoxin in each sample (Eapp) based on the gelation time. Eapp is then plotted against the actual spiked concentration of endotoxin added to the samples (Es), and a regression equation is calculated.
What do the regression equations mean in an Es-Eapp plot?
First, we assume that the degree of interference that a sample has is uniform within the range of endotoxin concentrations being measured. In other words, if a given sample affects endotoxin measurement at a constant rate (R), Eapp can be expressed using the following formula:
(1) Eapp = R・E
where E is the total amount of endotoxin in the sample.
E is the sum of the amount of endotoxin that was already present in the sample (Ec) and the amount that was spiked (Es). Thus, formula (1) can be written as follows:
(2) Eapp = R・(Ec+Es) = R・Ec + R・Es
The regression equation of the Es-Eapp plot can be expressed using formula (3) as follows:
(3) Eapp = a + b・Es
Based on the assumption, formulas (2) and (3) should be equal. Thus, the following calculations can be made:
(4) a = R・Ec
(5) b = R
Here R represents the degree of interference by the sample. Thus, R=1 means that the sample does not interfere with the measurement. Inhibitory and enhancing effects of a sample should be determined based on an appropriate standard. For example, FDA guidelines define that a sample has no interference when the recovery is within the range of 100±25%. Based on this definition, a sample would be enhancing to the LAL test when R>1.25 and inhibitory when R<0.75.
The amount of endotoxin that was already present in a sample can be calculated by dividing a by b.
Below is an example where an Es-Eapp plot was constructed using a drug.
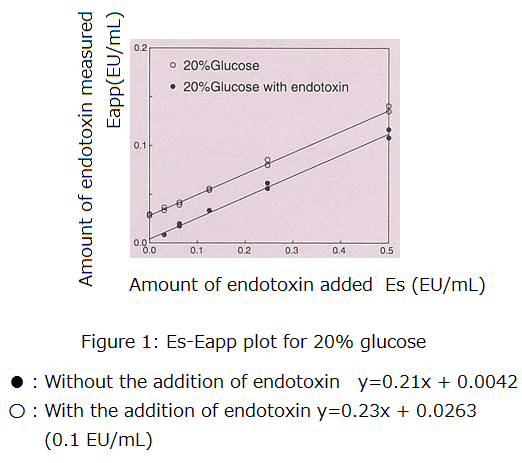
Figure 1 illustrates an Es-Eapp plot for 20% glucose with and without the addition of endotoxin (0.1 EU/mL). As expected, 20% glucose was inhibitory to the LAL test, with R being close to 0.2.
Furthermore, by calculating a/b, we determined that there was 0.020 EU/mL of endotoxin in the sample without the addition of endotoxin and 0.115 EU/mL in the sample with the addition of endotoxin. The difference between the samples (0.095 EU/mL) was 95% of the actual amount of endotoxin that was added (0.1 EU/mL). This suggests that the amount of endotoxin added to the sample can be measured with high accuracy despite the strong inhibitory effect.
In the sample without the addition of endotoxin, the gelation time was not obtained at Es = 0 (no spiked endotoxin). Nevertheless, we were able to estimate the amount of endotoxin in the sample.
As demonstrated, the Es-Eapp plot enables measurement of endotoxin without eliminating the effect of interference by a given sample. Furthermore, when a standard curve has poor linearity or when the degree of interference varies with the concentration of endotoxin, the linearity of a regression line can be examined to determine whether the method is valid.
The Es-Eapp plot may not be suitable in a routine examination given that the addition of various concentrations of endotoxin needs to be evaluated. Nevertheless, it is a useful tool when evaluating the conditions for measurements.
References
- Masakazu Tsuchiya et al. Proceedings for the 110th Annual Meeting of the Pharmaceutical Society of Japan. Vol. 3, p.127 (1990).
- Masakazu Tsuchiya et al. Journal of Antibacterial and Antifungal Agents. 18, 287 (1990).