All about Shibayagi's Insulin Assay Kits
- About Insulin
- About Shibayagi's insulin assay kit
- Specificity of kits
- Get focused on serial dilution!
About Insulin
What is insulin?
Insulin is a protein hormone secreted from B cells of islet of Langerhans in the pancreas with a molecular weight of about 5,800 and pI 5.4. It is consisted of 2 chains, A and B. It has 3 disulfide bonds formed between A6 and A11, A7 and B7, and A20 and B19. Exists as a dimer molecule in acidic to neutral water solution without Zn ion, and as a hexamer including two Zn ions in neutral solution if Zn ions are present.
Main targets of insulin are liver, muscle, and adipose tissue. Insulin actions in these targets are as follows. In the liver, it promotes glycogenesis, protein synthesis, fatty acid synthesis, carbohydrate utilization, and inhibition of gluconeogenesis. In the muscle, it promotes membrane permeability of carbohydrates, amino acids and K ion, glycogenesis, protein synthesis, while inhibits protein degradation. In the adipose tissue, it promotes membrane permeability of glucose and fatty acid synthesis.
Insulin biosynthesis and structure
A precursor of insulin, called proinsulin with a single polypeptide chain, is first synthesized in the cell, then sulfide bonds are formed, and finally by enzymatic cutting at two sites, active insulin and c-peptide (connecting peptide) are formed as shown in below figure.
Species difference of amino acid sequence of insulin
Table 1: Comparison of insulin amino acid sequences of various animals A-chain
| Sepecies | 1 | 6 | 11 | 16 | 21 |
| Human | GIVEQ | CCTSI | CSLYQ | LENYC | N |
| Chimpanzee | GIVEQ | CCTSI | CSLYQ | LENYC | N |
| Crab-eating macaque | GIVEQ | CCTSI | CSLYQ | LENYC | N |
| Green monkey | GIVEQ | CCTSI | CSLYQ | LENYC | N |
| Squirrel monkey | GVVDQ | CCTSI | CSLYQ | LQNYC | N |
| Dog | GIVEQ | CCTSI | CSLYQ | LENYC | N |
| Cat | GIVEQ | CCASV | CSLYQ | LEHYC | N |
| Cattle | GIVEQ | CCASV | CSLYQ | LENYC | N |
| Sheep | GIVEQ | CCAGV | CSLYQ | LENYC | N |
| Pig | GIVEQ | CCTSI | CSLYQ | LENYC | N |
| Horse | GIVEQ | CCTGI | CSLYQ | LENYC | N |
| Rabbit | GIVEQ | CCTSI | CSLYQ | LENYC | N |
| Rat I | GIVDQ | CCTSI | CSLYQ | LENYC | N |
| Rat II | GIVDQ | CCTSI | CSLYQ | LENYC | N |
| Mouse I | GIVDQ | CCTSI | CSLYQ | LENYC | N |
| Mouse II | GIVDQ | CCTSI | CSLYQ | LENYC | N |
| Fat sand rat | GIVEQ | CCTGI | CSLYQ | LENYC | N |
| Guinea pig | GIVDQ | CCTGT | CTRHQ | LQSYC | N |
| Golden hamster | GIVDQ | CCTSI | CSLYQ | LENYC | N |
| Long-tailed hamster | GIVDQ | CCTSI | CSLYQ | LENYC | N |
| Chicken | GIVEQ | CCHNT | CSLYQ | LENYC | N |
| Ostrich | GIVEQ | CCHNT | CSLYQ | LENYC | N |
| Turkey | GIVEQ | CCHNT | CSLYQ | LENYC | N |
| Duck | GIVEQ | CCENP | CSLYQ | LENYC | N |
| Hummingbird | GIVEQ | CCHNT | CSLYQ | LENYC | N |
| Xenopus I | GIVEQ | CCHST | CSLFQ | LESYC | N |
| Xenopus II | GIVEQ | CCHST | CSLFQ | LENYC | N |
| Chum salmon | GIVEQ | CCHKP | CNIFD | LQNYC | N |
| Tilapia | GIVEE | CCHKP | CTIFD | LQNYC | N |
| Carp | GIVEQ | CCHKP | CSIFE | LQNYC | N |
B-chain
| Sepecies | 1 | 6 | 11 | 16 | 21 | 26 |
| Human | FVNQH | LCGSH | LVEAL | YLVCG | ERGFF | YTPKT |
| Chimpanzee | FVNQH | LCGSH | LVEAL | YLVCG | ERGFF | YTPKT |
| Crab-eating macaque | FVNQH | LCGSH | LVEAL | YLVCG | ERGFF | YTPKT |
| Green monkey | FVNQH | LCGSH | LVEAL | YLVCG | ERGFF | YTPKT |
| Squirrel monkey | FVNQH | LCGPH | LVEAL | YLVCG | ERGFF | YAPKT |
| Dog | FVNQH | LCGSH | LVEAL | YLVCG | ERGFF | YTPKA |
| Cat | FVNQH | LCGSH | LVEAL | YLVCG | ERGFF | YTPKA |
| Cattle | FVNQH | LCGSH | LVEAL | YLVCG | ERGFF | YTPKA |
| Sheep | FVNQH | LCGSH | LVEAL | YLVCG | ERGFF | YTPKA |
| Pig | FVNQH | LCGSH | LVEAL | YLVCG | ERGFF | YTPKA |
| Horse | FVNQH | LCGSH | LVEAL | YLVCG | ERGFF | YTPKA |
| Rabbit | FVNQH | LCGSH | LVEAL | YLVCG | ERGFF | YTPKS |
| Rat I | FVKQH | LCGPH | LVEAL | YLVCG | ERGFF | YTPKSv |
| Rat II | FVKQH | LCGSH | LVEAL | YLVCG | ERGFF | YTPMS |
| Mouse I | FVKQH | LCGPH | LVEAL | YLVCG | ERGFF | YTPKS |
| Mouse II | FVKQH | LCGSH | LVEAL | YLVCG | ERGFF | YTPMS |
| Fat sand rat | FVNQH | LCGSH | LVEAL | YLVCG | ERGFF | YTPKF |
| Guinea pig | FVSRH | LCGSN | LVETL | YSVCQ | DDGFF | YIPKD |
| Golden hamster | FVNQH | LCGSH | LVEAL | YLVCG | ERGFF | YTPKS |
| Long-tailed hamster | FVNQH | LCGSH | LVEAL | YLVCG | ERGFF | YTPKS |
| Chicken | AANQH | LCGSH | LVEAL | YLVCG | ERGFF | YSPKA |
| Ostrich | AANQH | LCGSH | LVEAL | YLVCG | ERGFF | YSPKA |
| Turkey | AANQH | LCGSH | LVEAL | YLVCG | ERGFF | YSPKA |
| Duck | AANQH | LCGSH | LVEAL | YLVCG | ERGFF | YSPKT |
| Hummingbird | AVNQH | LCGSH | LVEAL | YLVCG | ERGFF | YSPKA |
| Xenopus I | LVNQH | LCGSH | LVEAL | YLVCG | DRGFF | YYPKV |
| Xenopus II | LANQH | LCGSH | LVEAL | YLVCG | DRGFF | YYPKI |
| Chum salmon | AAAQH | LCGSH | LVDAL | YLVCG | EKGFF | YTP |
| Tilapia | VGGPQ | HLCGS | HLVDA | LYLVC | GDRGF | FYNPR |
| Carp | NAGAP | QHLCG | SHLVD | ALYLV | CGPTG | FFYNP |
C-peptide
| Sepecies | 1 | 6 | 11 | 16 | 21 | 26 | 31 |
| Human | EAEDL | QVGQV | ELGGG | PGAGS | LQPLA | LEGSL | Q |
| Chimpanzee | EAEDL | QVGQV | ELGGG | PGAGS | LQPLA | LEGSL | Q |
| Crab-eating macaque | EAEDP | QVGQV | ELGGG | PGAGS | LQPLA | LEGSL | Q |
| Green monkey | EAEDP | QVGQV | ELGGG | PGAGS | LQPLA | LEGSL | Q |
| Squirrel monkey | EAEDL | QVGQV | ELGGG | SITGS | LPPLE | GPMQ | |
| Dog | EVEDL | QVRDV | ELAGA | PGEGG | LQPLA | LEGAL | Q |
| Cat | EAEDL | QGKDA | ELGEA | PGAGG | LQPSA | LEAPL | Q |
| Cattle | EVEGP | QVGAL | ELAGG | PGAGG | LEGPP | Q | |
| Sheep | EVEGP | QVGAL | ELAGG | PGAGG | LEGPP | Q | |
| Pig | EAENP | QAGAV | ELGGG | LGGLQ | ALALE | GPPQ | |
| Horse | EAEDP | QVGEV | ELGGG | PGLGG | LQPLA | LAGPQ | Q |
| Rabbit | EVEEL | QVGQA | ELGGG | PGAGG | LQPSA | LELAL | Q |
| Rat I | EVEDP | QVPQL | ELGGG | PEAGD | LQTLA | LEVAR | Q |
| Rat II | EVEDP | QVAQL | ELGGG | PGAGD | LQTLA | LEVAR | Q |
| Mouse I | EVEDP | QVEQL | ELGGS | PGDLQ | TLALE | VARQ | |
| Mouse II | EVEDP | QVAQL | ELGGG | PGAGD | LQTLA | LEVAQ | Q |
| Fat sand rat | GVDDP | QMPQL | ELGGS | PGAGD | LRALA | LEVAR | Q |
| Guinea pig | ELEDP | QVEQT | ELGMG | LGAGG | LQPLA | LEMAL | Q |
| Golden hamster | GVEDP | QVAQL | ELGGG | PGADD | LQTLA | LEVAQ | Q |
| Long-tailed hamster | GVEDP | QVAQL | ELGGG | PGADD | LQTLA | LEVAQ | Q |
| Chicken | DVEQP | LVSSP | LRGEA | GVLPF | QQEEY | EKV | |
| Ostrich | DVEQP | LVSSP | LRGEA | GVLPF | QQEEY | EKV | |
| Turkey | DVEQP | LVSSP | LRGEA | GVLPF | QQEEY | EKV | |
| Duck | DVEQP | LVNGP | LHGEV | GELPF | QHEEY | Q | |
| Hummingbird | DAEHP | LVNGP | LHGEV | GDLPF | QQEEF | EKV | |
| Xenopus I | DMEQA | LVSGP | QDNEL | DGMQL | QPQEY | QKM | |
| Xenopus II | DIEQA | QVNGP | QDNEL | DGMQF | QPQEY | QKM | |
| Chum salmon | DVDPL | IGFLS | PKSAK | ENEEY | PFKDQ | TEMMV | |
| Tilapia | DVDPL | LGFLP | PKAGG | AVVQG | GENEV | TFKDQ | MEMMV |
| Carp | DVDPP | LGFLP | PKSAQ | ETEVA | DFAFK | DHAEV | IR |
Table 2 Total molecular weight of insulin of various animals
| Human | 5808.42 |
| Chimpanzee | 5808.42 |
| Rat, Mouse I | 5804.47 |
| Rat, Mouse II | 5787.38 |
| Dog | 5778.39 |
| Cat | 5757.38 |
| Monkey (common) | 5759.40 |
| Pig | 5778.39 |
| Cattle | 5734.34 |
Potencies of insulin preparations of various animal species
Potency of an insulin preparation was originally determined by bioassay. For example, 1 rabbit unit is the amount of insulin which lowers the blood sugar level of 24-hours fasting rabbit by 50% within 5 hours after administration. It corresponds to about 3IU. However, whole body bioassay inevitably shows poor precision owing to individual variation with index of precision about 0.15. From such reason international standard preparation has been used. The 4th international standard preparation is a mixture of purified preparations of bovine(52%) and porcine(48%) insulin, and 1mg of the standard is defined as 24IU (=0.04167mg/IU).
Following further purification of insulin, WHO issued 1st International Standard in 1986 which has the potency of 26IU/mg (0.038mg/IU). In the same year, 1st International Standard of bovine insulin, the potency of which is 25.7IU/mg, and Porcine insulin 1st International Standard, 26IU/mg, were provided. One ampoule conteins about 50mg. Before these standards, in 1974, 1 st International Reference Preparation of human insulin for immunoassay was provided as 3 IU/ampoule. Based on the above data, if the biological activity of insulin per molecule is the same among various animal species, potencies of animal insulin might be calculated from their molecular weights. But, so far, we do not have experimental proof about this. As the molecular weights of insulin of various animals are nearly the same, and the differences are within 1%, there may be no critical fault if we think that the general potency of insulin is 26IU/mg.
Rat and mouse have two molecular species of insulin, type 1 and type 2. Amino acid sequences of these molecular species are same between rat and mouse. But as their ratios are different between the two animals, it is recommended to use standard preparation derived from each animals.
About Shibayagi's insulin assay kit
Assay strategy of Shibayagi's kit
A monoclonal anti-insulin antibody is coated on the assay plate to capture insulin in the assay sample. Then another monoclonal insulin antibody to which biotin is labeled is added to bind to another portion of captured insulin, and finally peroxidase-avidin conjugate is added. As avidin binds to biotin firmly, the amount of insulin can be determined from peroxidase activity by adding chromogenic substrate for peroxidase.
Note: Biotin and avidin
Biotin: A kind of growth factor present in every cells and belongs to vitamin B complex. Also called vitamin H. As it acts as co-factor of various enzymes related to carboxylation reactions, it is also called coenzyme R. The richest sources are liver, kidney, pancreas, yeast and milk. It is important in fatty acid and carbohydrate metabolism, and deficiency causes skin lesion.
Avidin: A basic glycoprotein present in raw egg-white. Produced in oviducts of avians and amphibians. It is composed essentially same single chain 4 subunits each 128 amino acids (N-terminal amino acid is alanine and C-terminal glutamic acid). Molecular weight is about 66,000. It is destructed by heat treatment (cooking) and irradiation.
Avidin binds firmly with biotin and inactivates it. Each subunit can bind one biotin. The dissociation constant, Kd, is 10-15M.Intake of large amounts of egg-white to rats and chicken makes biotin deficient and causes skin lesion and growth retardation. This effect is reversed by biotin administration.
We are utilizing such a specific and strong binding of biotin and avidin in our assay system.
Classification of Shibayagi's insulin assay kits -Classification according to animal species, specificity, sensitivity, and related substance (C-peptide)- Animal species
Our insulin assay kits are for animal species shown below.
| Rat insulin ELISA kits: | TMB (liquid type), OPD (tablet type) |
| High sensitivity type (U type), (U-E type) | |
| High specificity type (S type) | |
| Mouse insulin ELISA kits: | TMB (liquid type), OPD (tablet type) |
| High sensitivity type (U type) | |
| High specificity type (S type) | |
| Dog insulin ELISA kit: | TMB (liquid type) |
| Pig insulin ELISA kit: | TMB (liquid type) |
| Monkey insulin ELISA kit: | TMB (liquid type) |
Besides these, we are providing insulin standard preparation for rabbit and hamster. By using these standard preparations with rat TMB kit, you can measure rabbit and hamster insulin.
Specificity for insulin
Ordinary insulin assay kits: All ELISA kits except for S type
Ordinary assay kits show the affinity to both insulin and proinsulin. Normally, in circulating blood, both proinsulin and processed insulin are secreted with minor ratio of proinsulin to insulin, and secretion of proinsulin is in parallel with insulin. So, in usual studies, it is enough to measure both of them by using ordinary assay kit.
Insulin-specific assay kit: S type (at present for rat insulin)
This type of kit shows a very low cross-reactivity to proinsulin (see data in specificity section), and practically can measure only insulin in the presence of proinsulin. This type of kit is useful when levels of proinsulin change owing physiological conditions. From the difference of assay values between ordinary and specific assay kits we can estimate proinsulin secretion.
From assay sensitivity
Kits of ordinary sensitivity: TMB and OPD
These types of kits are for measurement of insulin in normal state animals. In any species, a good standard curve is obtained in a range of 0.156 to 10ng/ml.
Ultra-sensitive assay kits: U type, U-E type
For rat and mouse, we are providing ultra-sensitive assay kits, U type. This type of kit is improved to be able to measure insulin levels in fasted animals with an excellent precision. The assay ranges are 25-1,500 pg/ml for rat, and 39-2,500 pg/ml for mouse. Because rat U type needs an overnight incubation, we improved the incubation period, and prepared U-E type the assay range of which is 39-2,500 pg/ml. The highly specific assay kit of S type also attained higher sensitivity than ordinary TMB and OPD, the assay range of which is 100 to 10,000 pg/m.
Kit for insulin-related substance: rat and mouse C-peptide ELISA kits
We provide assay kits for C-peptide that has closely related to insulin. Amino acid sequences of C-peptides are to some extent different between rat and mouse. C-peptide is secreted with insulin after processing of proinsulin to insulin and C-peptide. C-peptide has a longer biological half-life than insulin. So, C-peptide is measured in observation of biosynthesis and secretory functions for insulin. C-peptide is also found in urine in considerably high concentration, and the level is parallel to that in plasma, so, can be applied to urinary samples.
Measurement of C-peptide is also useful in estimation of insulin secretion to culture medium of e.g. isolated islets more than measurement of insulin itself, because very often insulin is added to a culture medium to make the measurement of insulin secreted to the medium by cultured cells. As C-peptide is secreted into the medium in equi-molar base, we can estimate insulin secretion by measuring C-peptide. Our C-peptide kit recognizes both C-peptide 1 and 2, the total amount of C-peptide is measured by the kit. Data for the specificity of the C-peptide assay kit is shown in Section 5, gSpecificity of kitsh.
Standard curve and assay range of the kit
You can find standard curve in instruction manual in every kit. Generally, assay range is 0.2-12ng/ml irrespective of animal species. For mouse and rat, we are also providing ultra-sensitive assay kits, U-type. Their standard curves are shown below.
- Standard curve of U-Type assay kit for rat
- Standard curve of U-Type assay kit for mouse
- Standard curve of S type assay kit for rat
Precision, reproducibility, recovery test and dilution test of the kits
| Rat (OPD kit) | ||
|---|---|---|
| Precision (Average CV) | 2.06 % | 3 samples, 5 replicates |
| Reproducibility (Average CV) | 2.87 % | 3 samples, 8 replicates, 3 days |
| Rat (TMB kit) | ||
| Precision (Average CV) | 1.65 % | 3 samples, 8 replicates |
| Reproducibility (Average CV) | 2.81 % | 3 samples, 5 replicates, 3 days |
| Mouse (OPD kit) | ||
| Precision (Average CV) | 1.58 % | 3 samples, 10 replicates |
| Reproducibility (Average CV) | 1.98 % | 3 samples, triplicates, 3 days |
| Mouse (TMB kit) | ||
| Precision (Average CV) | 1.98 % | 3 samples, 10 replicates |
| Reproducibility (Average CV) | 3.91 % | 3 samples, triplicates, 3 days |
| Dog (TMB kit) | ||
| Precision (Average CV) | 4.32 % | 3 samples, triplicates |
| Reproducibility (Average CV) | 4.18 % | 3 samples, 4 replicates, 3 days |
| Monkey (TMB kit) | ||
| Precision (Average CV) | 3.21 % | 3 samples, 10 replicates |
| Reproducibility (Average CV) | 3.09 % | 3 samples, 4 replicates, 3 days |
Pig (TMB kit)...data in detail
Precision (Within assay variation) n=5
| Mean(ng/ml) | S.D. | CV(%) |
|---|---|---|
| 0.991 | 0.0321 | 3.24 |
| 0.482 | 0.0175 | 3.63 |
| 0.201 | 0.0099 | 4.93 |
Reproducibility (Between assay variation) n=5
| Mean(ng/ml) | S.D. | CV(%) |
|---|---|---|
| 1.425 | 0.0562 | 3.87 |
| 0.901 | 0.0321 | 3.56 |
| 0.346 | 0.0162 | 4.68 |
Recovery test
| Sample | Added(ng/ml) | Found(ng/ml) | Recovered(ng/ml) | Recovery(%) |
|---|---|---|---|---|
| 1 | 0 | 0.343 | * | * |
| 0.25 | 0.576 | 0.233 | 93.2 | |
| 0.5 | 0.802 | 0.459 | 91.7 | |
| 1 | 0.952 | 1.295 | 95.2 | |
| 2 | 2.301 | 1.958 | 97.9 | |
| 2 | 0 | 0.202 | * | * |
| 0.25 | 0.437 | 0.235 | 93.8 | |
| 0.5 | 0.666 | 0.464 | 92.8 | |
| 1 | 1.201 | 0.999 | 99.9 | |
| 2 | 2.240 | 2.038 | 101.9 |
Rat insulin assay kit (U-type)
Precision (Within assay variation) 3 samples
| Sample A | Sample B | Sample C | ||||
|---|---|---|---|---|---|---|
| Assay value | A.450nm | pg/ml | A.450nm | pg/ml | A.450nm | pg/ml |
| 0.165 | 25.6 | 0.413 | 271.4 | 1.816 | 1251.7 | |
| 0.165 | 25.6 | 0.416 | 273.9 | 1.801 | 1242.1 | |
| 0.164 | 24.1 | 0.415 | 273.1 | 1.801 | 1242.1 | |
| 0.164 | 24.1 | 0.417 | 274.8 | 1.806 | 1245.3 | |
| 0.164 | 24.1 | 0.419 | 276.4 | 1.798 | 1240.2 | |
| mean SD CV(%) | 0.164 | 24.7 | 0.416 | 273.9 | 1.804 | 1244.3 |
| 0.0005 | 0.808 | 0.0022 | 1.88 | 0.0071 | 4.5345 | |
| 0.3 | 3.3 | 0.5 | 0.7 | 0.4 | 0.4 | |
Reproducibility (Between assay variation) n=3
| Sample A | Sample B | Sample C | ||||
|---|---|---|---|---|---|---|
| Assay value | A.450nm | pg/ml | A.450nm | pg/ml | A.450nm | pg/ml |
| 0.173 | 33.2 | 0.268 | 232.7 | 1.182 | 1003.5 | |
| 0.192 | 35.0 | 0.339 | 236.9 | 1.031 | 1012.0 | |
| 0.182 | 33.7 | 0.302 | 230.5 | 1.075 | 999.1 | |
| mean SD CV(%) | 0.182 | 34.0 | 0.303 | 233.4 | 1.096 | 1004.9 |
| 0.0096 | 0.943 | 0.0355 | 3.26 | 0.0777 | 6.5060 | |
| 5.2 | 2.8 | 11.7 | 1.4 | 7.1 | 0.6 | |
Recovery test (n=3)
| Sample | Added(pg/ml) | Found(pg/ml) | Recovered(pg/ml) | Recovery(%) |
|---|---|---|---|---|
| 1 | 0 | 54 | ||
| 50 | 103 | 49 | 98.0 | |
| 150 | 198 | 144 | 96.0 | |
| 350 | 393 | 339 | 96.9 | |
| 2 | 0 | 432 | ||
| 500 | 952 | 520 | 104 | |
| 750 | 1204 | 772 | 103 | |
| 1000 | 1430 | 998 | 99.8 |
Dilution test
Rat insulin assay kit (U-E type)
Precision
| Sample ID | A (pg/ml) |
B (pg/ml) |
C (pg/ml) |
|---|---|---|---|
| 1 | 1058 | 320 | 91.0 |
| 2 | 1008 | 308 | 87.3 |
| 3 | 987 | 309 | 91.9 |
| 4 | 1074 | 298 | 97.1 |
| 5 | 1065 | 304 | 93.7 |
| 6 | 1058 | 305 | 92.3 |
| 7 | 1056 | 313 | 92.2 |
| 8 | 1070 | 333 | 91.2 |
| mean. | 1047 | 311 | 92.1 |
| SD | 31.8 | 10.9 | 2.73 |
| CV(%) | 3.0 | 3.5 | 3.0 |
Reproducibility
pg/ml, n=3
| Sample ID | Day 1 | Day 2 | Day 3 | Day 4 | Mean. | SD | CV(%) |
|---|---|---|---|---|---|---|---|
| F | 1221 | 1234 | 1254 | 1244 | 1238 | 13.8 | 1.1 |
| G | 365 | 311 | 323 | 310 | 327 | 26.0 | 8.0 |
| H | 75.8 | 71.8 | 76.3 | 73.1 | 74.3 | 2.14 | 2.9 |
Recovery test
pg/ml, n=3
| Sample ID | Added | Found | Recovered | Recovery(%) |
|---|---|---|---|---|
| D | 0 | 41.1 | - | - |
| 51.0 | 89.1 | 48.0 | 94.1 | |
| 101 | 143 | 102 | 101 | |
| 148 | 185 | 144 | 97.3 | |
| E | 0 | 386 | - | - |
| 374 | 741 | 355 | 94.9 | |
| 1120 | 1504 | 1118 | 100 | |
| 1494 | 1844 | 1458 | 97.6 |
Dilution test 
Rat insulin assay kit (S-type)
Precision
ng/ml
| Well | A | B | C |
|---|---|---|---|
| 1 | 6.51 | 2.97 | 1.11 |
| 2 | 6.39 | 2.91 | 1.01 |
| 3 | 5.97 | 2.89 | 1.03 |
| 4 | 6.09 | 2.94 | 1.02 |
| 5 | 6.01 | 2.89 | 1.00 |
| 6 | 5.95 | 2.84 | 1.02 |
| 7 | 5.97 | 2.98 | 1.02 |
| 8 | 6.29 | 2.98 | 1.05 |
| mean. | 6.15 | 2.92 | 1.03 |
| SD | 0.22 | 0.051 | 0.034 |
| CV(%) | 3.6 | 1.8 | 3.3 |
Reproducibility
ng/ml, n=3
| Sample No. | Day 0 | Day 1 | Day 2 | Day 3 | Mean | SD | CV(%) |
|---|---|---|---|---|---|---|---|
| D | 5.10 | 5.03 | 5.12 | 5.12 | 5.09 | 0.041 | 0.8 |
| E | 0.989 | 0.965 | 0.950 | 0.984 | 0.972 | 0.018 | 1.8 |
| F | 0.510 | 0.513 | 0.522 | 0.536 | 0.520 | 0.012 | 2.2 |
Recovery test
ng/ml, n=3
| Sample No. G | |||
|---|---|---|---|
| Added | Found | Recovered | Recovery(%) |
| - | 1.01 | - | - |
| 0.19 | 1.19 | 0.18 | 95 |
| 0.39 | 1.38 | 0.37 | 95 |
| 0.79 | 1.76 | 0.75 | 95 |
| 1.97 | 2.99 | 1.98 | 101 |
| Sample No. H | |||
| Added | Found | Recovered | Recovery(%) |
| - | 4.24 | - | - |
| 1.69 | 5.89 | 1.65 | 98 |
| 3.39 | 7.50 | 3.26 | 96 |
| 5.08 | 9.10 | 4.86 | 96 |
| 6.88 | 10.6 | 6.37 | 94 |
Dilution test
Correlation of between assay values obtained by rat S-type and rat T-type kits 
Mouse (U-type kit)
Precision (Within assay variation), n=5
| Sample | A | B | C | |||
|---|---|---|---|---|---|---|
| N | A.450nm | pg/ml | A.450nm | pg/ml | A.450nm | pg/ml |
| 1 | 0.970 | 1380 | 0.261 | 270 | 0.143 | 101 |
| 2 | 0.956 | 1363 | 0.259 | 266 | 0.147 | 109 |
| 3 | 0.956 | 1363 | 0.260 | 268 | 0.146 | 107 |
| 4 | 0.959 | 1367 | 0.262 | 272 | 0.142 | 99 |
| 5 | 0.948 | 1353 | 0.263 | 274 | 0.147 | 109 |
| Mean | 0.958 | 1365 | 0.261 | 270 | 0.145 | 105 |
| SD | 0.0079 | 9.68 | 0.0016 | 3.27 | 0.0023 | 4.81 |
| CV (%) | 0.8 | 0.7 | 0.6 | 1.2 | 1.6 | 4.6 |
Reproducibility (Between assay variation), n=3
| Sample | E | F | G |
|---|---|---|---|
| Day | pg/ml | pg/ml | pg/ml |
| 1 | 1365 | 270.0 | 106.0 |
| 2 | 1326 | 271.1 | 105.4 |
| 3 | 1359 | 269.5 | 109.3 |
| Mean | 1350 | 270.2 | 106.9 |
| SD | 20.9 | 0.799 | 2.11 |
| CV (%) | 1.5 | 0.3 | 2.0 |
Recovery test pg/ml, n=2
| Sample | Added | Found | Recovered | Recovery(%) |
|---|---|---|---|---|
| 1 | 0 | 483 | - | - |
| 150 | 646 | 163 | 109 | |
| 550 | 1040 | 557 | 101 | |
| 1350 | 1823 | 1340 | 99.3 | |
| 2 | 0 | 91.8 | - | - |
| 50 | 140 | 48.2 | 96.4 | |
| 200 | 290 | 198.2 | 99.1 | |
| 350 | 443 | 351.2 | 100.3 |
Correlation of assay values obtained by U-type and standard kits 
Dilution test 
Mouse insulin assay kit (S-type)
Precision
| Sample No. | A | B |
|---|---|---|
| 1 | 2488 | 491 |
| 2 | 2477 | 470 |
| 3 | 2410 | 457 |
| 4 | 2434 | 465 |
| 5 | 2433 | 459 |
| 6 | 2342 | 442 |
| 7 | 2358 | 459 |
| 8 | 2390 | 495 |
| mean. | 2417 | 467 |
| SD | 52.3 | 17.8 |
| CV(%) | 2.2 | 3.8 |
pg/ml
Reproducibility
| Sample No. | Day 1 | Day 2 | Day 3 | Day 4 | mean | SD | CV(%) |
|---|---|---|---|---|---|---|---|
| C | 166 | 156 | 153 | 153 | 157 | 6.16 | 3.9 |
| D | 628 | 625 | 624 | 624 | 625 | 1.89 | 0.30 |
| E | 2505 | 2409 | 2427 | 2549 | 2473 | 65.86 | 2.7 |
pg/ml, n=3
Recovery test
| Sample No. F | |||
|---|---|---|---|
| Added | Found | Recovered | Recovery(%) |
| 0 | 1315 | - | - |
| 324 | 1632 | 317 | 97.8 |
| 630 | 1935 | 620 | 98.4 |
| 889 | 2172 | 857 | 96.4 |
| 1305 | 2625 | 1310 | 100 |
| Sample No. G | |||
| Added | Found | Recovered | Recovery(%) |
| 0 | 512 | - | - |
| 426 | 925 | 413 | 96.9 |
| 559 | 1073 | 561 | 100 |
| 662 | 100 | 665 | 101 |
| 745 | 1270 | 758 | 102 |
pg/ml, n=3
Dilution test
Correlation between assay values obtained by mouse S-type kit and mouse U-type kit 
C-Peptide assay kits
Rat C-peptide assay kit (U-type)
Precision
| Well | A | B |
|---|---|---|
| 1 | 1015 | 214 |
| 2 | 1027 | 222 |
| 3 | 1038 | 211 |
| 4 | 1043 | 219 |
| 5 | 1029 | 232 |
| 6 | 1034 | 209 |
| 7 | 1039 | 231 |
| 8 | 1041 | 224 |
| mean | 1033 | 220 |
| SD | 9.60 | 8.51 |
| CV (%) | 0.93 | 3.86 |
pg/ml
Reproducibility
| Sample | Day 1 | Day 2 | Day 3 | Day 4 | mean | SD | CV (%) |
|---|---|---|---|---|---|---|---|
| C | 1499 | 1435 | 1491 | 1458 | 1471 | 29.68 | 2.02 |
| D | 599 | 605 | 569 | 559 | 583 | 22.55 | 3.87 |
| E | 63.9 | 58.2 | 59.9 | 64.2 | 61.6 | 2.98 | 4.83 |
pg/ml, n=4
Recovery test
pg/ml
| Added | Found | Recovered | Recovery (%) |
|---|---|---|---|
| 0.00 | 180 | - | - |
| 110 | 291 | 111 | 101 |
| 161 | 332 | 152 | 94.5 |
| 209 | 379 | 199 | 95.1 |
| Added | Found | Recovered | Recovery (%) |
| 0.00 | 360 | - | - |
| 263 | 616 | 256 | 97.1 |
| 526 | 909 | 549 | 104 |
| 658 | 1040 | 680 | 103 |
Dilution test 
Mouse C-peptide assay kit (U-type)
Precision
pg/ml
| Well | A | B |
|---|---|---|
| 1 | 976 | 238 |
| 2 | 969 | 230 |
| 3 | 965 | 230 |
| 4 | 1023 | 235 |
| 5 | 977 | 231 |
| 6 | 1018 | 228 |
| 7 | 1038 | 229 |
| 8 | 995 | 225 |
| mean | 995 | 231 |
| SD | 27.7 | 4.10 |
| CV (%) | 2.78 | 1.78 |
Reproducibility
pg/ml, n=4
| Sample | Day 1 | Day 2 | Day 3 | Day 4 | mean | SD | CV (%) |
|---|---|---|---|---|---|---|---|
| C | 1502 | 1500 | 1499 | 1501 | 1500 | 1.12 | 0.07 |
| D | 301 | 302 | 301 | 300 | 301 | 0.66 | 0.22 |
| E | 60.9 | 63.8 | 62.2 | 58.8 | 61.4 | 2.13 | 3.46 |
Recovery test
pg/ml, n=2
| Added | Found | Recovered | Recovery (%) |
|---|---|---|---|
| 0.00 | 300 | - | - |
| 265 | 551 | 250 | 94 |
| 398 | 683 | 382 | 96 |
| 531 | 827 | 527 | 99 |
| Added | Found | Recovered | Recovery (%) |
| 0.00 | 58.2 | - | - |
| 28.9 | 86.7 | 28.5 | 99 |
| 38.6 | 98.2 | 40.0 | 104 |
| 77.4 | 139 | 80.8 | 104 |
Dilution test
Specificity of kits
Ordinary insulin assay kits
Our ordinary kits show similar tendency as to their specificity as shown below. C-peptide, as far as we tested, does not show cross-reactivity. Heterologous insulin, more or less, shows cross-reactivity.
As to proinsulin, though we could examined only human proinsulin from the availability of standard preparation, we consider that homologous proinsulin may crossreacts. We will show specificity of rat insulin kit in detail.
| Kits | Rat insulin kit (All types) |
Mouse insulin kit (All types) |
Dog insulin kit | Monkey insulin kit | Pig insulin kit |
|---|---|---|---|---|---|
| Human insulin | + | + | + | + | + |
| Human proinsulin | + | + | + | + | + |
| Human C-peptide | - | - | - | - | - |
| Rat insulin | + | + | + | + | + |
| Mouse insulin | + | + | + | + | + |
| Rat C-paptide | - | - | - | - | - |
| Mouse C-peptide | - | - | - | - | - |
| Dog insulin | + | + | + | + | + |
| Monkey insulin | + | + | + | + | + |
| Pig insulin | + | + | + | + | + |
Rat insulin ELISA kit cross-reaction test
| Preparation | Cross-reactivity |
|---|---|
| Rat insulin C-peptide | 100% - |
| Mouse insulin | 102% |
| Pig insulin | 120% |
| Dog insulin | + (See data below*) |
| Human insulin | 185% |
*Comment: When purified dog insulin preparation is measured with rat insulin assay kit, the cross-reactivity will change according to its concentration.
| 10ng.ml | 120% |
| 5ng/ml | 100% |
| 1ng/ml | 120% |
Ref. Mouse insulin ELISA kit cross-reactivity test
| Mouse insulin | 100% |
|---|---|
| Mouse C-peptide | 0% |
| Rat insulin | 98% |
Specificity of highly insulin-specific kits (S type) for rat insulin
Influence of rat proinsulin added to the sample
| Rat proinsulin added (A) | Assay value as rat insulin (B) | Influence on assay system (B-1.00)/A, % |
|---|---|---|
| 0 | 1.00 | - |
| 1.0 | 1.01 | 1.0 |
| 2.0 | 1.03 | 1.5 |
| 4.0 | 1.07 | 1.8 |
| 8.0 | 1.19 | 2.4 |
unit:ng/ml, n=2
Cross-reactivity
| Substance | Reactivity(%) | Concentration added |
|---|---|---|
| Rat Insulin | 100 | |
| Rat C-peptide | Less than lower assay limit | 100ng/ml |
| Rat Proinsulin | < 5 | 100ng/ml |
| Mouse Insulin | 102 | 10ng/ml |
| Mouse C-peptide | Less than lower assay limit | 100ng/ml |
| Porcine Insulin | 120 | 10ng/ml |
| Dog Insulin | Cross-reacted | 10ng/ml |
| Bovine Insulin | Cross-reacted | 10ng/ml |
| Human Insulin | 185 | 10ng/ml |
| Rabbit Insulin | 180 | 10ng/ml |
Specificity of highly insulin-specific kits (S type) for mouse insulin
Influence of mouse proinsulin added to the sample
| Sample serum No. I | ||
|---|---|---|
| Mouse proinsulin added | Insulin assay value | Cross-reactivity (%) |
| - | 106.0 | - |
| 100 | 106.9 | 0.9 |
| 500 | 112.5 | 1.3 |
| 5000 | 286.0 | 3.6 |
pg/ml, n=2
Cross-reactivity
| Substances | Reactivity(%) | Concentration tested |
|---|---|---|
| Mouse Insulin | 100 | |
| Mouse C-peptide | Less than assay limit | 50ng/ml |
| Mouse Proinsulin | < 5 | 50ng/ml |
| Rat Insulin | 98 | 10ng/ml |
| Rat C-peptide | Less than assay limit | 50ng/ml |
| Porcine Insulin | 118 | 10ng/ml |
| Dog Insulin | Reacted | 10ng/ml |
| Bovine Insulin | Reacted | 10ng/ml |
| Human Insulin | 185 | 10ng/ml |
| Rabbit Insulin | 180 | 10ng/ml |
Specificity of rat C- peptide assay kit (U-type)
| Animal species | Substances | Cross-reactivity(%) |
|---|---|---|
| Rat | C-peptide | 100 |
| Insulin | Less than assay limit | |
| Pro-Insulin | Less than assay limit | |
| Mouse | C-peptide | 92 |
| Insulin | Less than assay limit | |
| Pro-Insulin | Less than assay limit | |
| Human | C-peptide | 90 |
| Insulin | Less than assay limit | |
| Pro-Insulin | Less than assay limit | |
| Porcine | Insulin | Less than assay |
| Bovine | Insulin | Less than assay limit |
*Cross-reactivity was estimated at 15,000 pg/ml
Specificity of mouse C-peptide assay kit (U-type)
| Animal species | Substances | Cross-reactivity(%) |
|---|---|---|
| Mouse | C-peptideT | 100 |
| C-peptideU | 100 | |
| Insulin | Less than assay limit | |
| Pro-Insulin | Less than assay limit | |
| Rat | C-peptide | 89 |
| Insulin | Less than assay limit | |
| Pro-Insulin | Less than assay limit | |
| Human | C-peptide | 85 |
| Insulin | Less than assay limit | |
| Pro-Insulin | Less than assay limit | |
| Porcine | Insulin | Less than assay limit |
| Bovine | Insulin | Less than assay limit |
*Cross-reactivity was estimated at 15000 pg/ml
Sample treatment for measurement
Dilution of samples containing high levels of insulin
Dilute samples with assay buffer when insulin contents are too high to measure.
Measurement of insulin in culture cells
After washing cultured cells, homogenize them in proper volume of acid-ethanol medium (a mixture of 7.5ml of HCl and 370ml of ethanol), and stand it for several hours at 4C. Then centrifuge the homogenate, neutralize supernatant fluid with 6M ammonia and centrifuge. The supernatant fluid can be used as assay sample after proper dilution according to its insulin content.
Use of anticoagulants to obtain plasma
Serum sample is useful for insulin measurement. But if you want to use plasma, obtain plasma by using heparin at final concentration of 10mg/ml(=1.2U/ml)~100mg/ml or EDTA-2Na final 1~1.5mg/ml(EDTA-2K final 1.11~1.7mg/ml), or citric acid final
0.8~1.0%.We do not recommend NaF because it is a peroxidase inhibitor.
Addition of anticoagulants may influence assay results. Our experimental results are shown below.
In rat insulin measurement, anticoagulants examined seem to have no considerable effects. When you use anticoagulants, all the samples should be treated in the same way to get same effects if any. Influence of anticoagulants on rat insulin ELISA kit (n=8)
| Sample | Anticoagulant | Absent(ng/ml) | Present(ng/ml) | Present/absent(%) |
|---|---|---|---|---|
| 1 | Heparin 10mcg/ml |
0.523 2.001 |
0.508 2.041 |
97.1 102 |
| 2 | EDTA 1 mg/ml |
0.725 2.348 |
0.718 2.252 |
99.1 95.9 |
| 3 | Citric acid 0.8% |
0.662 2.161 |
0.633 1.995 |
95.7 92.3 |
Stability of insulin in blood
Blood contains insulinase and other protein-degradating enzymes. So, serum or plasma samples should be assayed as soon as possible after sampling. In some samples insulin levels are decreased following storage at room temperature. Samples could be kept for several hours before assay at 4C, and longer than that at lower temperature than -35C. If samples have to be stored for long period, -80C is recommended.
If you are afraid of degradation of insulin during storage
For instance, if you can not measure immediately after sampling, and have to store them in a refrigerator, you can add aprotinin, an inhibitor of insulin degradating enzyme, at a final concentration of 100~500KIU/ml.
Influence of hemolysis
Test was carried out with n=5
Figures in columns are insulin assay values without hemolysis, while lower values are ratios of assay values ratios (with/without hemolysis) expressed by percentage.
| Samples | Hemoglobin concentration (mg/dl) | |||
|---|---|---|---|---|
| 0 | 10 | 20 | 40 | |
| 1 | 0.521 100% |
0.533 102% |
0.500 96.0% |
0.456 87.5% |
| 2 | 1.04 100% |
0.998 96% |
0.989 95.1% |
0.925 88.9% |
| 3 | 3.56 100% |
3.35 94.1% |
3.39 95.2% |
2.56 71.9% |
As shown above, with hemoglobin concentration above 40mg/dl, the assay values are lowered.
Hemoglobin concentration and coloration (shown below).
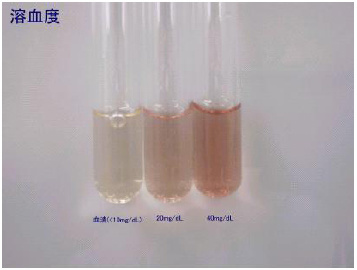
Be careful! Mouse blood is easily hemolysed.
Get focused on serial dilution!
Including ELISA, usually serially diluted standards and samples were measured at the same time, and the samples' assay values are calculated from the obtained calibration curve in assay systems. In ELISA, standard solutions are mostly prepared by serial dilution, where you should add a fixed quantity of dilution buffer to test tubes, then add the same quantity of thick standard solution to the first test tube and mix, and from the mixed solution, let's say, Std. 7, take the same volume with dilution buffer and apply to the next test tube (Std. 6), and mix to make one rank higher serial standard, and so on. Let's think one example: the volume is 100μL and you use a pipette called 100μL of single stroke dispenser (the most common, tip changeable pipette to dispense 100μL with one whole stroke) for both standard and dilution buffer. In the ISO 8655-5 (International Organization for Standardization), this pipette's acceptable limit of maximum random error is defined as 0.3μL, so let's calculate assuming that there's 0.3% variation. As a result, 95% confidence limit (= 2CV) is +/- 0.6% in the highest Std. 7 and +/- 4% in the lowest Std. 1. What if a multi delivery pipette with a syringe type tip is used for the buffer's dispensing? This type of pipette's acceptable limit of maximum random error would be very large, however, let's assume 1%. If single stroke is used (CV 0.3%) for the standard solution, the confidence limit is +/- 9.2% in the Std. 1. If a pipette with CV 1% is used for both would be about +/- 15%, and another with CV 2% would be +/- 30%. In this way, this value gets larger proportionally almost to the pipette's random error.
To prepare serial standard solutions, chose pipette carefully. Never set a small volume using large nominal volume of pipette (e.g. set at 100μL using 1ml piston pipette), and avoid use of multi delivery pipette.