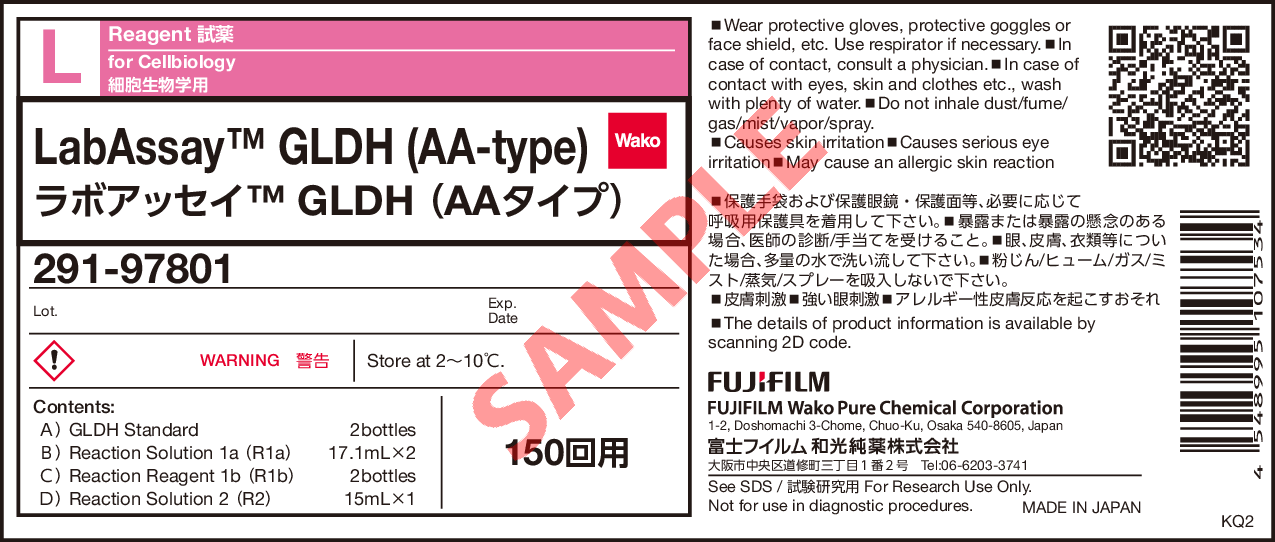
LabAssay (TM) GLDH (AA-type)
- for Cellbiology
- Manufacturer :
- FUJIFILM Wako Pure Chemical Corporation
- Storage Condition :
- Keep at 2-10 degrees C.
- GHS :
-


-
 Close
Close -
 Close
Close
- Structural Formula
- Label
- Packing
- SDS
|
Comparison
|
Product Number
|
Package Size
|
Price
|
Availability
|
Certificate of Analysis
|
Purchase |
|---|---|---|---|---|---|---|
|
|
|
150Tests
|
|
In stock in Japan |
※Check availability in the US with the distributor.
Document
Kit component
For 150 tests
| GLDH Standard | 2 bottles |
|---|---|
| Reaction Solution 1a (R1a) | 17.1 mL/2 bottles |
| Reaction Solution 1b (R1b)* | 2 bottles |
| Reaction Solution 2 (R2) | 15 mL/1 bottle |
Product Overview
GLDH is an essential enzyme to synthesize urea and it catalyzes the reversible conversion from glutamate to alpha-ketoglutarate.
Clinically GLDH is a deviation enzyme in blood which deviates from cells when the cells are damaged, only low level of GLDH is found in serum from healthy individuals. As GLDH is particularly abundant in hepatocytes, it is used as a marker for liver injury in toxicity studies and related applications. It has also been reported that GLDH is easier to detect than ALT in rats with acetaminophen-induced liver damage1).
LabAssay™ GLDH (AA-type) is a kit designed to measure GLDH for use with automated analyzer in samples. GLDH levels in samples can be measured quickly.
Kit Performance
| Analysis sample | Human Serum/Plasma (EDTA) Mouse Serum/Plasma (EDTA) Rat Serum/Plasma (EDTA) Dog Serum/Plasma (EDTA) Rabbit Serum/Plasma (EDTA) Monkey Serum* |
|---|---|
| Calibration curve range | 1.0-150 U/L |
| Sample volume | 15 μL (in case of Hitachi Automatic Analyzer 3500) |
| Measurement duration | Approx. 10 min |
| Wavelength | Primary wavelength 340 nm Reference wavelength 405 nm |
Compatible Automated Analyzers
- Hitachi Automatic Analyzer 3500 (Hitachi High-Tech) etc.
Please contact us for other compatible automated analyzers, assay parameters, and protocols.
Preparation of GLDH Standard Solution
Please read the section "8. Reagent Preparation" in the package insert and proceed with the preparation accordingly. Additionally, we have provided a video on YouTube explaining the preparation process and important points to note, so please be sure to check it.
Assay Principle
GLDH in the sample catalyzes the conversion of ammonia and α-ketoglutarate to glutamate. During this reaction, NADH is oxidized to NAD+, resulting in a decrease in absorbance at 340 nm. The GLDH level is determined by measuring this decrease in absorbance.

Data
Rpeatability (within run precision)
Repeatability was conducted by measuring eight-fold assays of serum/plasma (EDTA) samples from human, mouse, rat, dog and rabbit at two concentrations with this product.
| n\ID | Human serum | Human plasma (EDTA) |
Mouse serum | Mouse plasma (EDTA) |
Rat serum | Rat plasma (EDTA) |
Dog serum | Dog plasma (EDTA) |
Rabbit serum | Rabbit plasma (EDTA) |
||||||||||
|---|---|---|---|---|---|---|---|---|---|---|---|---|---|---|---|---|---|---|---|---|
| ID1 (U/L) |
ID2 (U/L) |
ID1 (U/L) |
ID2 (U/L) |
ID1 (U/L) |
ID2 (U/L) |
ID1 (U/L) |
ID2 (U/L) |
ID1 (U/L) |
ID2 (U/L) |
ID1 (U/L) |
ID2 (U/L) |
ID1 (U/L) |
ID2 (U/L) |
ID1 (U/L) |
ID2 (U/L) |
ID1 (U/L) |
ID2 (U/L) |
ID1 (U/L) |
ID2 (U/L) |
|
| 1 | 57.3 | 13.6 | 44.0 | 11.1 | 50.1 | 10.5 | 47.7 | 4.4 | 54.8 | 14.1 | 50.9 | 16.1 | 42.8 | 11.5 | 42.8 | 15.5 | 51.4 | 11.9 | 59.2 | 14.9 |
| 2 | 57.7 | 13.2 | 43.8 | 11.1 | 49.9 | 10.1 | 48.1 | 4.5 | 54.1 | 15.0 | 51.2 | 15.7 | 43.3 | 11.8 | 43.3 | 15.0 | 51.8 | 11.8 | 59.2 | 15.6 |
| 3 | 57.9 | 12.6 | 43.8 | 11.0 | 50.1 | 10.4 | 47.9 | 4.2 | 52.8 | 13.4 | 50.3 | 16.0 | 43.2 | 11.5 | 43.2 | 15.7 | 51.8 | 12.2 | 59.5 | 15.5 |
| 4 | 57.4 | 12.6 | 43.7 | 11.1 | 49.5 | 10.4 | 47.8 | 4.3 | 53.4 | 13.7 | 50.9 | 16.0 | 43.4 | 11.5 | 43.4 | 15.4 | 51.5 | 11.9 | 59.9 | 15.6 |
| 5 | 57.7 | 12.8 | 43.8 | 10.9 | 49.7 | 10.1 | 47.8 | 4.3 | 54.9 | 13.3 | 50.9 | 15.9 | 43.2 | 11.3 | 43.2 | 13.9 | 51.7 | 11.9 | 60.0 | 15.5 |
| 6 | 57.1 | 13.0 | 43.7 | 10.9 | 50.0 | 10.5 | 47.6 | 4.7 | 53.9 | 14.4 | 50.6 | 16.2 | 43.5 | 12.0 | 43.5 | 15.0 | 51.7 | 11.5 | 60.1 | 15.0 |
| 7 | 57.3 | 12.8 | 43.6 | 10.2 | 51.5 | 10.4 | 47.8 | 4.6 | 54.0 | 14.9 | 50.7 | 16.0 | 43.5 | 11.8 | 43.5 | 14.3 | 51.6 | 12.1 | 59.6 | 15.6 |
| 8 | 57.4 | 12.6 | 43.6 | 10.7 | 40.8 | 10.4 | 48.5 | 4.4 | 54.3 | 13.6 | 51.2 | 15.7 | 43.6 | 11.8 | 43.6 | 15.0 | 51.9 | 11.9 | 59.8 | 15.2 |
| mean | 57.5 | 12.9 | 43.8 | 10.9 | 49.0 | 10.4 | 47.9 | 4.4 | 54.0 | 14.1 | 50.8 | 16.0 | 43.3 | 11.7 | 43.3 | 15.0 | 51.7 | 11.9 | 59.7 | 15.4 |
| SD | 0.266 | 0.355 | 0.131 | 0.306 | 3.35 | 0.160 | 0.283 | 0.17 | 0.692 | 0.661 | 0.302 | 0.177 | 0.253 | 0.233 | 0.253 | 0.609 | 0.167 | 0.207 | 0.346 | 0.288 |
| CV(%) | 0.5 | 2.7 | 0.3 | 2.8 | 6.8 | 1.5 | 0.6 | 3.8 | 1.3 | 4.7 | 0.6 | 1.1 | 0.6 | 2.0 | 0.6 | 4.1 | 0.3 | 1.7 | 0.6 | 1.9 |
[Result]
The CV (%) of human serum was 05-2.7%, human plasma (EDTA) was 0.3-2.8%, mouse serum was 1.5-6.8%, mouse plasma (EDTA) was 0.6-3.8%, and rat serum was 1.3-4.7%, rat plasma (EDTA) 0.6-1.1%, dog serum was 0.6-2.0%, dog plasma (EDTA) was 0.6-4.1%, rabbit serum was 0.3-1.7% and rabbit plasma (EDTA) was 0.6-1.9%, indicating good repeatability.
Reproducibility (between run precision)
Reproducibility was conducted by measuring serum/plasma (EDTA) samples from human, mouse, rat, dog and rabbit at two concentrations each for four days with this product.
| Day\ID | Human serum | Human plasma (EDTA) |
Mouse serum | Mouse plasma (EDTA) |
Rat serum | Rat plasma (EDTA) |
Dog serum | Dog plasma (EDTA) |
Rabbit serum | Rabbit plasma (EDTA) |
||||||||||
|---|---|---|---|---|---|---|---|---|---|---|---|---|---|---|---|---|---|---|---|---|
| ID3 (U/L) |
ID4 (U/L) |
ID3 (U/L) |
ID4 (U/L) |
ID3 (U/L) |
ID4 (U/L) |
ID3 (U/L) |
ID4 (U/L) |
ID3 (U/L) |
ID4 (U/L) |
ID3 (U/L) |
ID4 (U/L) |
ID3 (U/L) |
ID4 (U/L) |
ID3 (U/L) |
ID4 (U/L) |
ID3 (U/L) |
ID4 (U/L) |
ID3 (U/L) |
ID4 (U/L) |
|
| 1 | 50.8 | 2.5 | 54.0 | 6.2 | 44.7 | 3.5 | 48.2 | 5.8 | 54.2 | 5.4 | 37.4 | 2.7 | 49.9 | 5.9 | 49.3 | 2.7 | 46.1 | 3.2 | 37.7 | 4.6 |
| 2 | 51.1 | 2.4 | 54.9 | 6.6 | 44.7 | 3.2 | 51.2 | 5.7 | 52.8 | 5.7 | 39.5 | 2.6 | 49.1 | 5.9 | 49.2 | 2.9 | 45.9 | 3.1 | 38.1 | 4.4 |
| 3 | 48.3 | 2.6 | 51.4 | 6.0 | 43.4 | 3.3 | 48.2 | 5.6 | 52.3 | 5.7 | 36.7 | 2.7 | 48.5 | 5.9 | 47.8 | 2.7 | 44.7 | 3.4 | 36.7 | 4.2 |
| 4 | 49.7 | 2.8 | 53.7 | 6.3 | 45.5 | 3.4 | 47.5 | 5.4 | 54.8 | 5.4 | 38.0 | 2.8 | 50.8 | 6.2 | 50.0 | 2.9 | 47.2 | 2.9 | 39.0 | 4.5 |
| mean | 50.0 | 2.6 | 53.5 | 6.3 | 44.6 | 3.4 | 48.8 | 5.6 | 53.5 | 5.6 | 37.9 | 2.7 | 49.6 | 6.0 | 49.1 | 2.8 | 46.0 | 3.2 | 37.9 | 4.4 |
| SD | 1.27 | 0.17 | 1.49 | 0.25 | 0.869 | 0.13 | 1.65 | 0.17 | 1.17 | 0.17 | 1.19 | 0.082 | 1.00 | 0.15 | 0.922 | 0.12 | 1.02 | 0.21 | 0.954 | 0.17 |
| CV(%) | 2.5 | 6.6 | 2.8 | 4.0 | 2.0 | 3.9 | 3.4 | 3.0 | 2.2 | 3.1 | 3.1 | 3.0 | 2.0 | 2.5 | 1.9 | 4.1 | 2.2 | 6.6 | 2.5 | 3.9 |
[Result]
The CV (%) of human serum was 2.5-6.6%, human plasma (EDTA) was 2.8-4.0%, mouse serum was 2.0-3.9%, mouse plasma (EDTA) was 3.0-3.4%, and rat serum was 2.2-3.1%, rat plasma (EDTA) 3.0-3.1%, dog serum was 2.0-2.5%, dog plasma (EDTA) was 1.9-4.1%, rabbit serum was 2.2-6.6% and rabbit plasma (EDTA) was 2.5-3.9%, indicating good reproducibility.
Dilution Linearity Test
Serum and plasma (EDTA) from human, mouse, rat, dog and rabbit as well as serum from monkey spiked with the standard, were serially diluted twofold with saline and measured in duplicate to assess linearity.
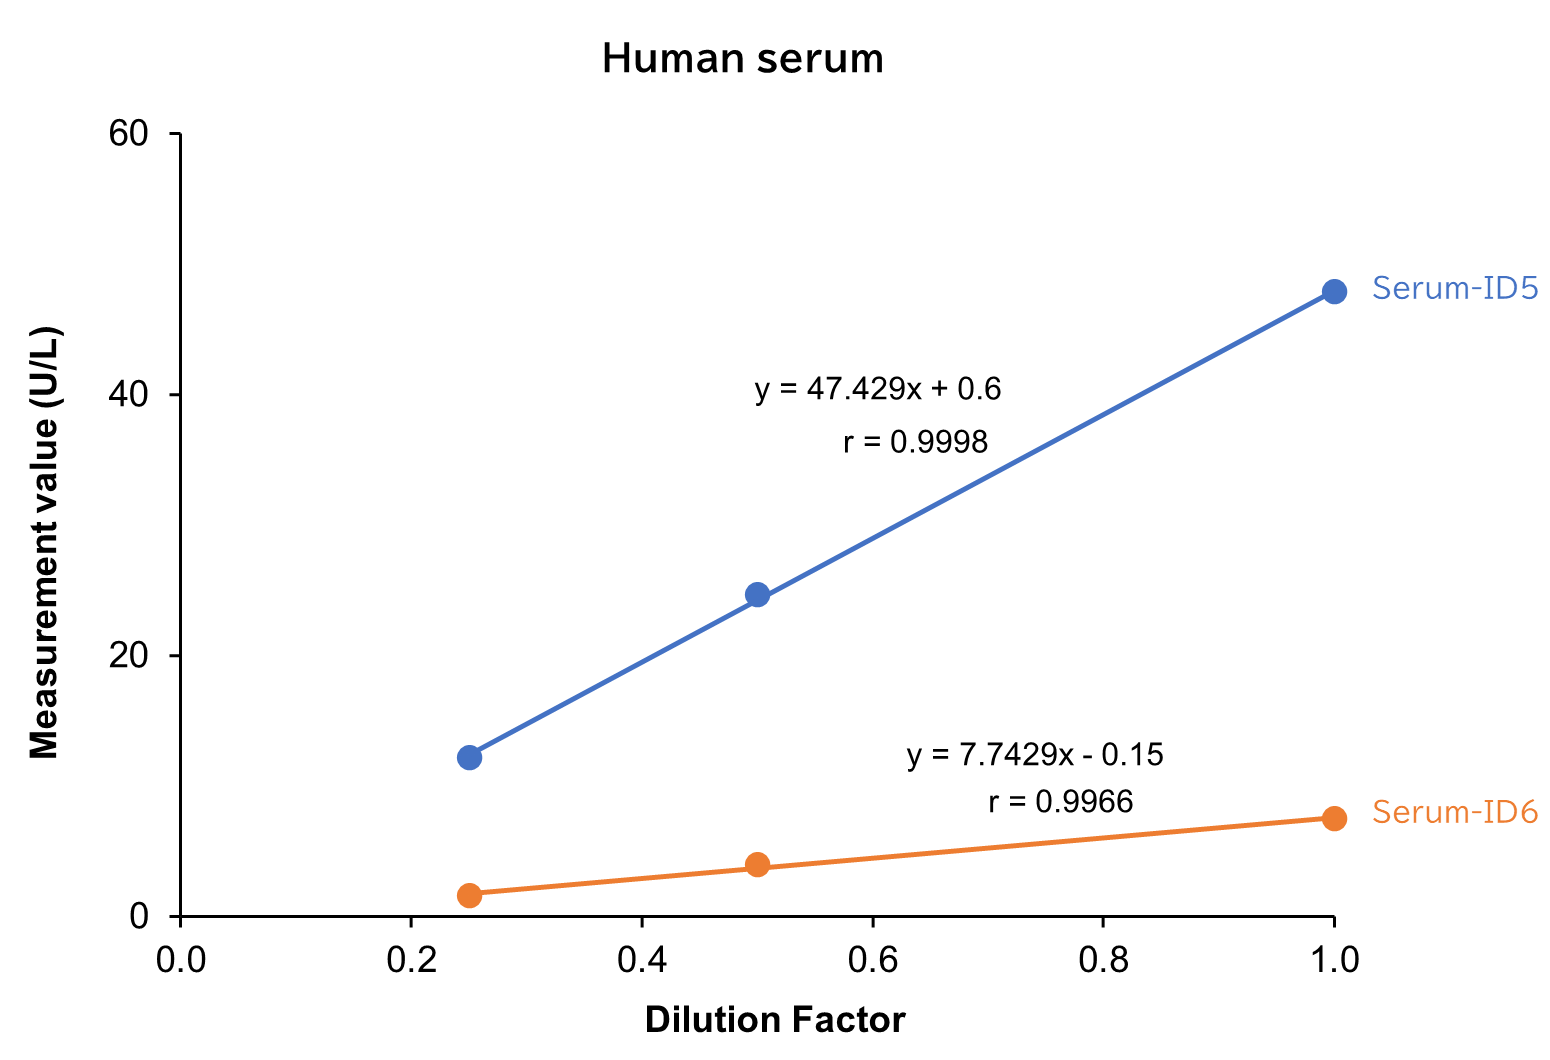
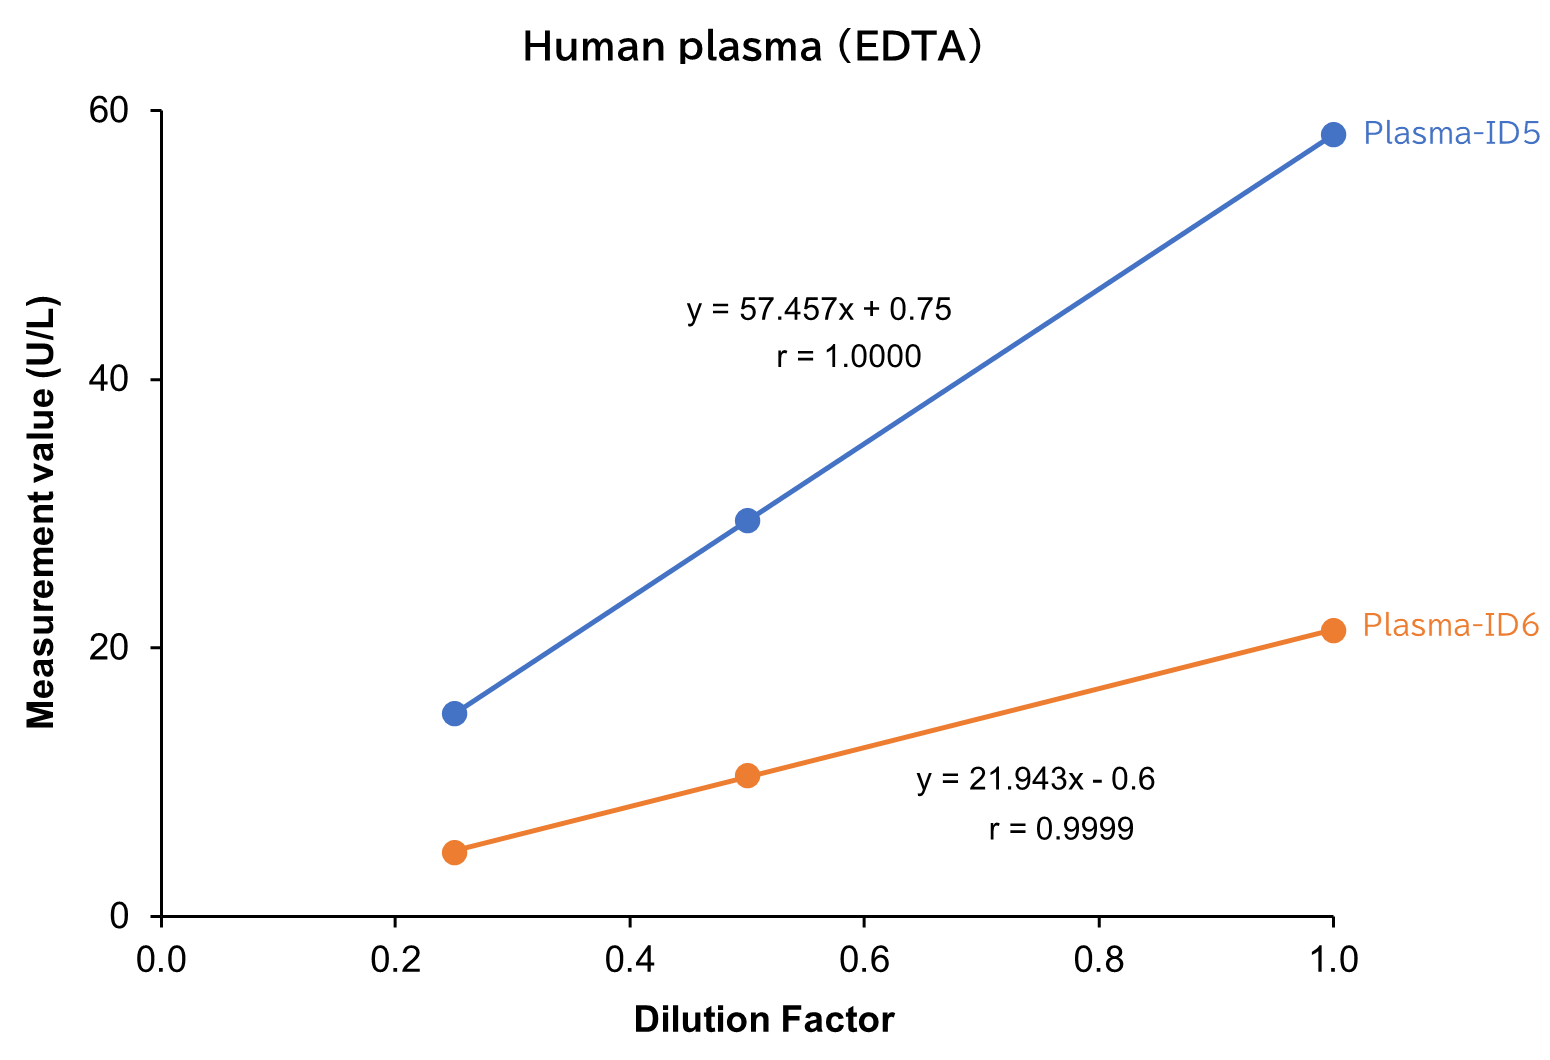
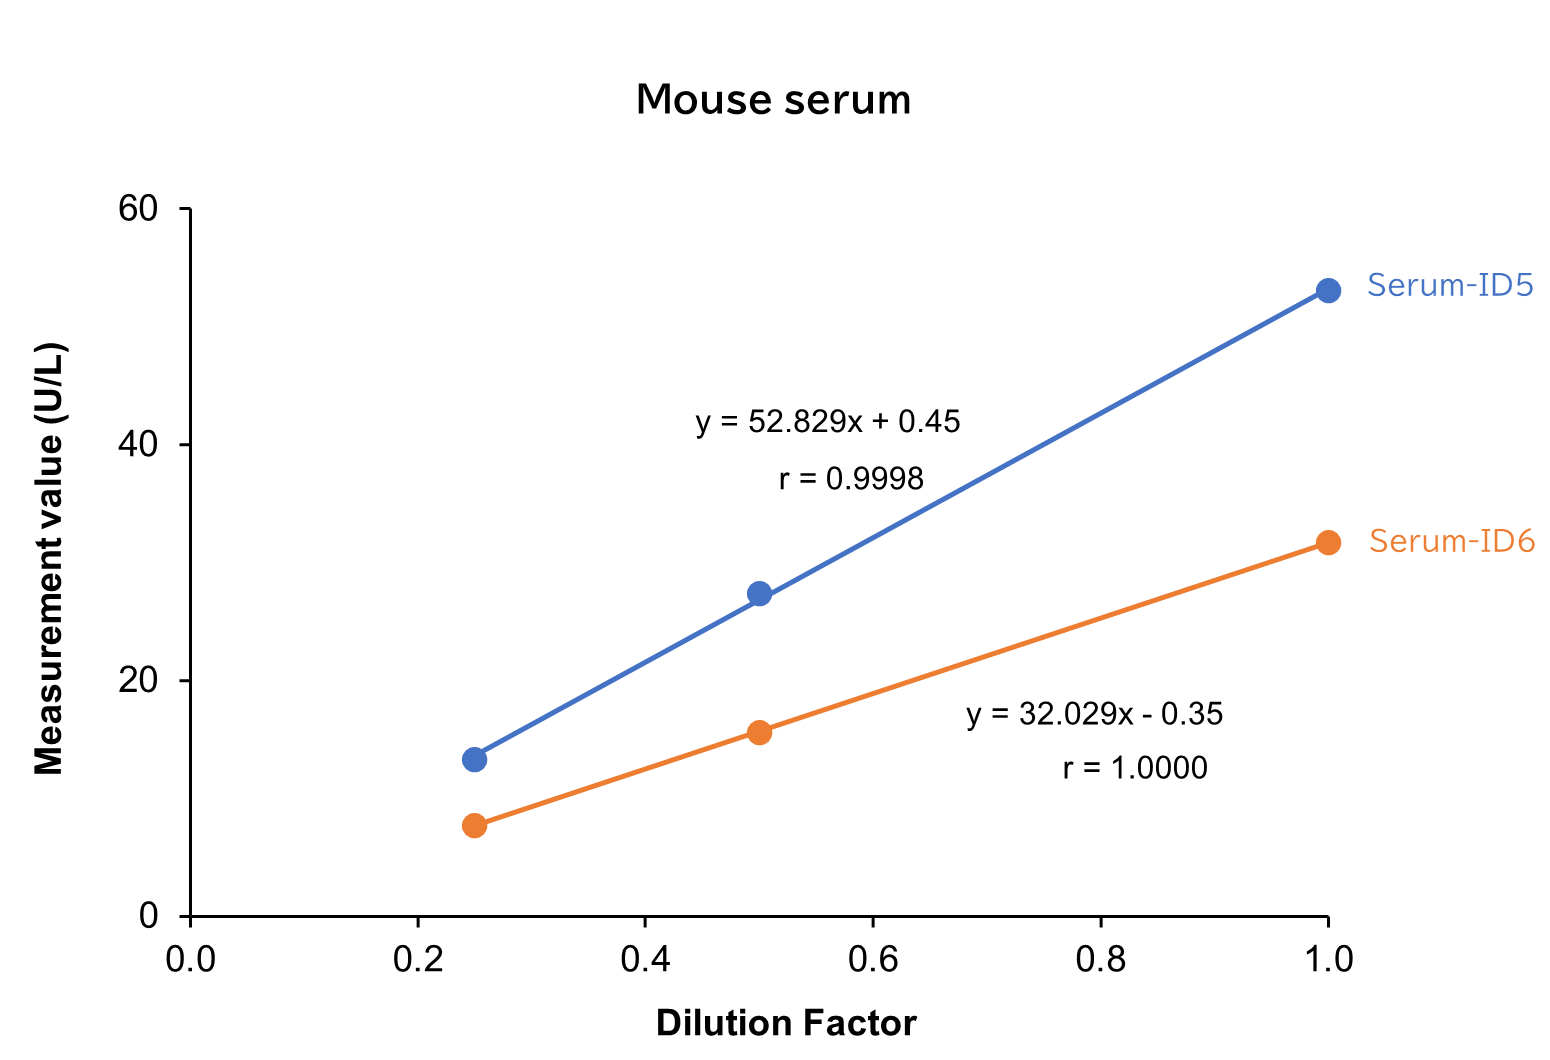
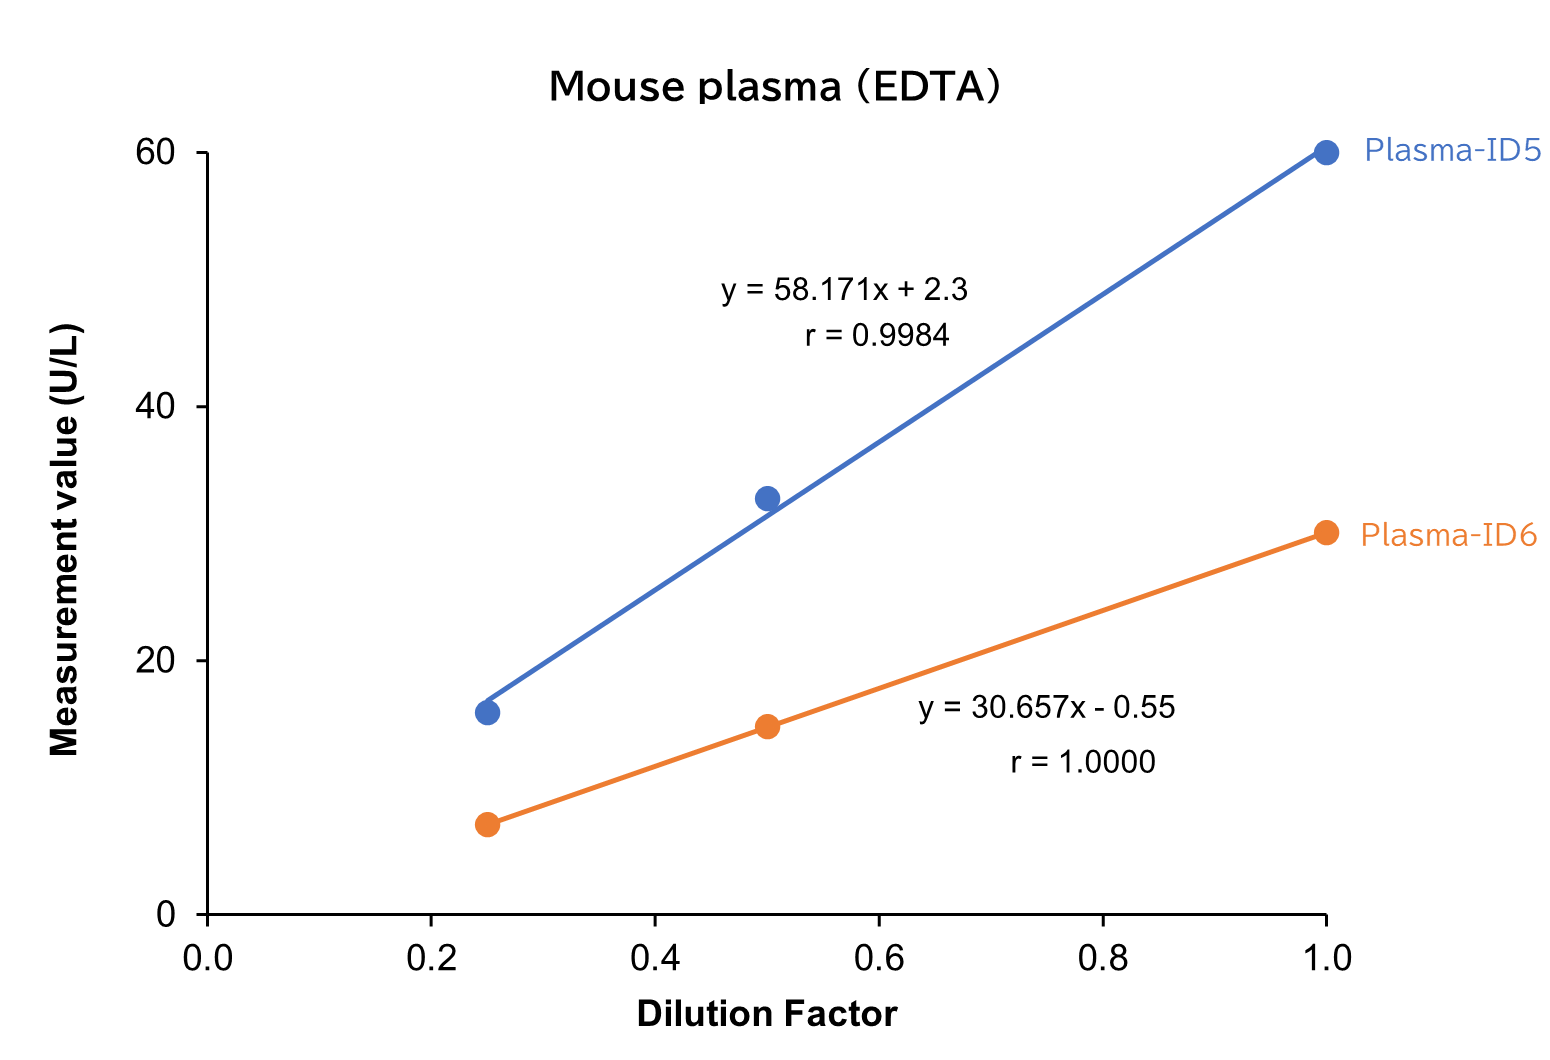
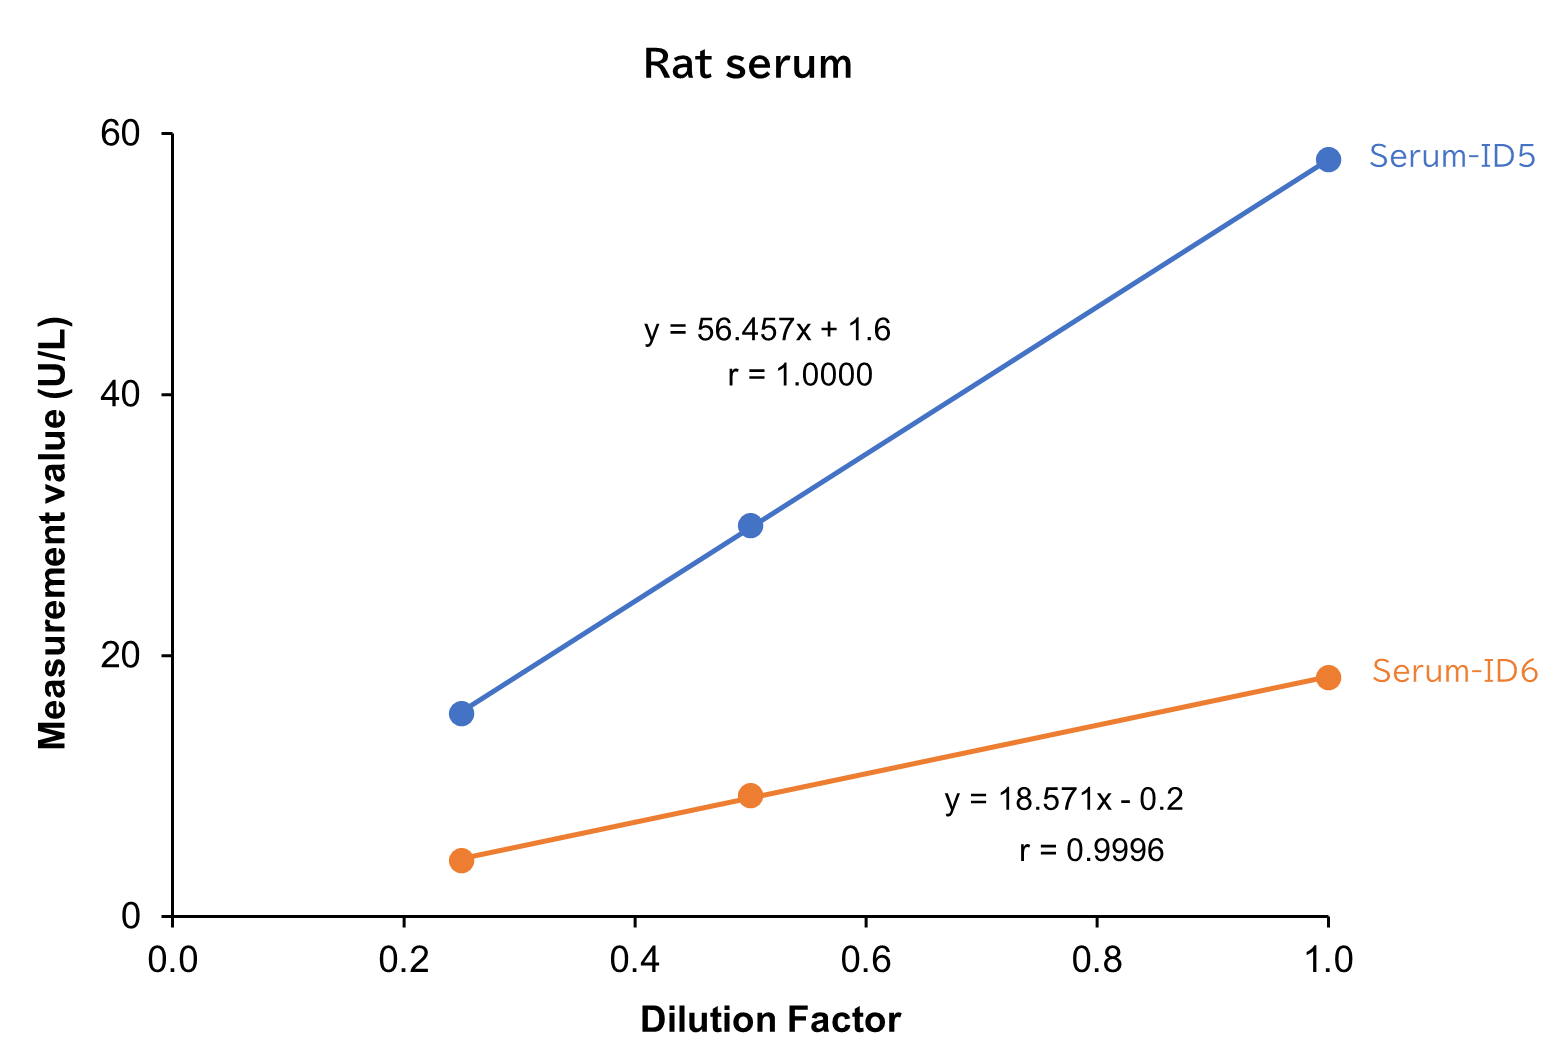
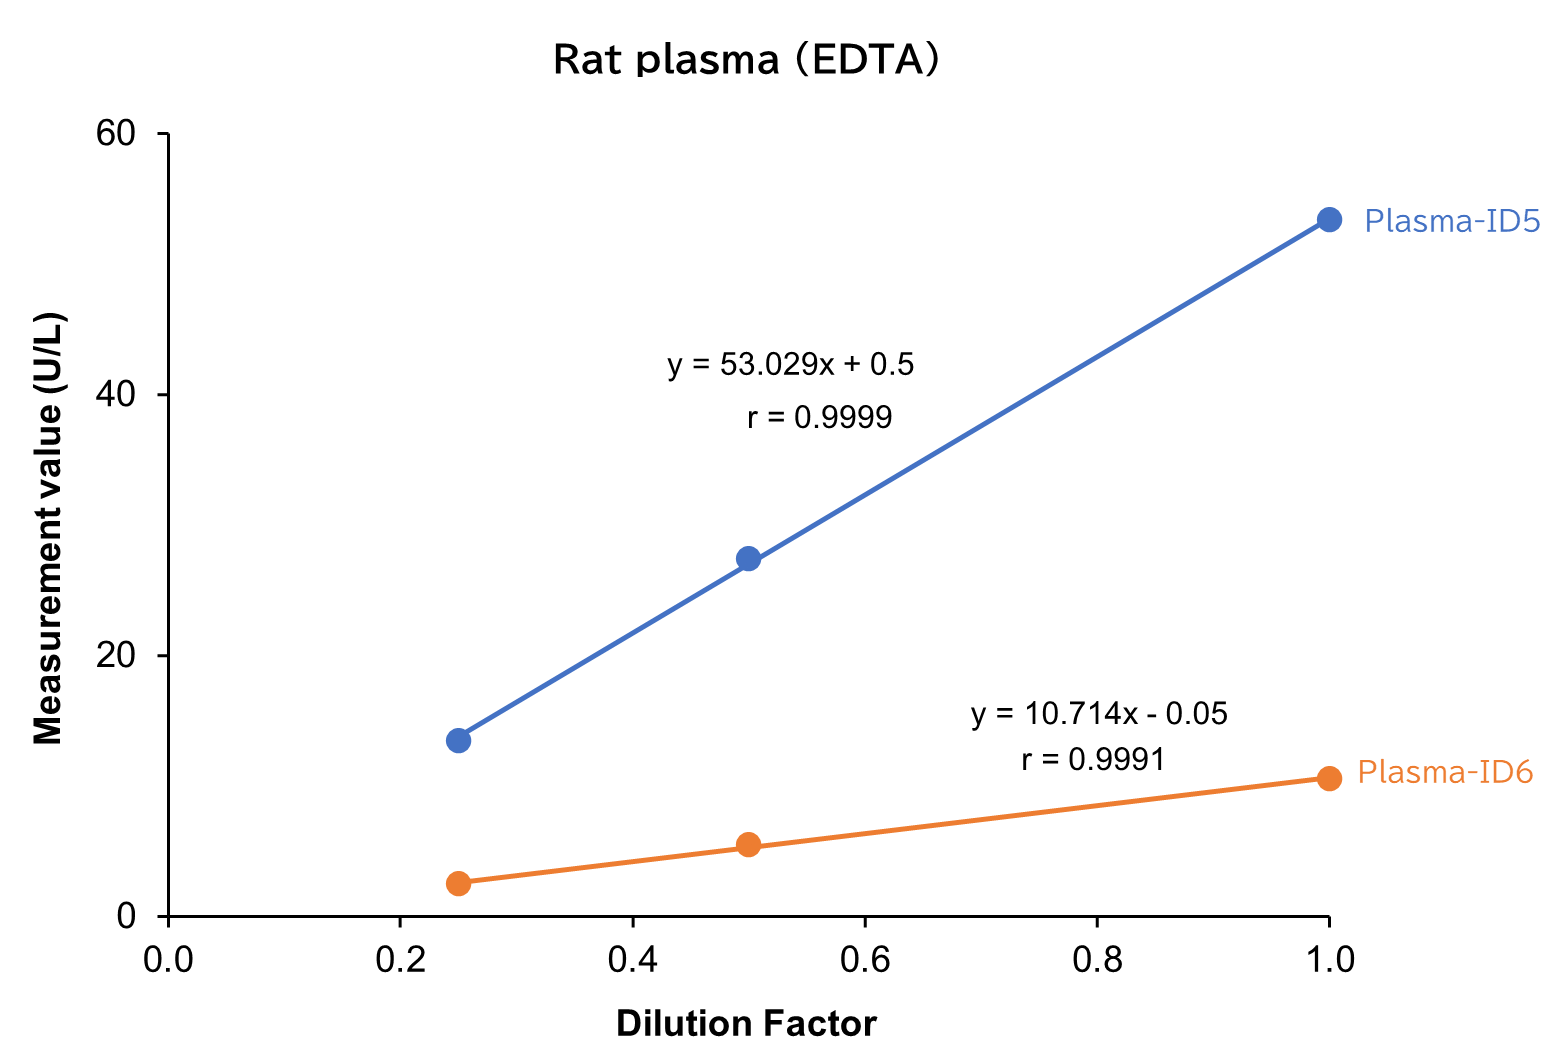
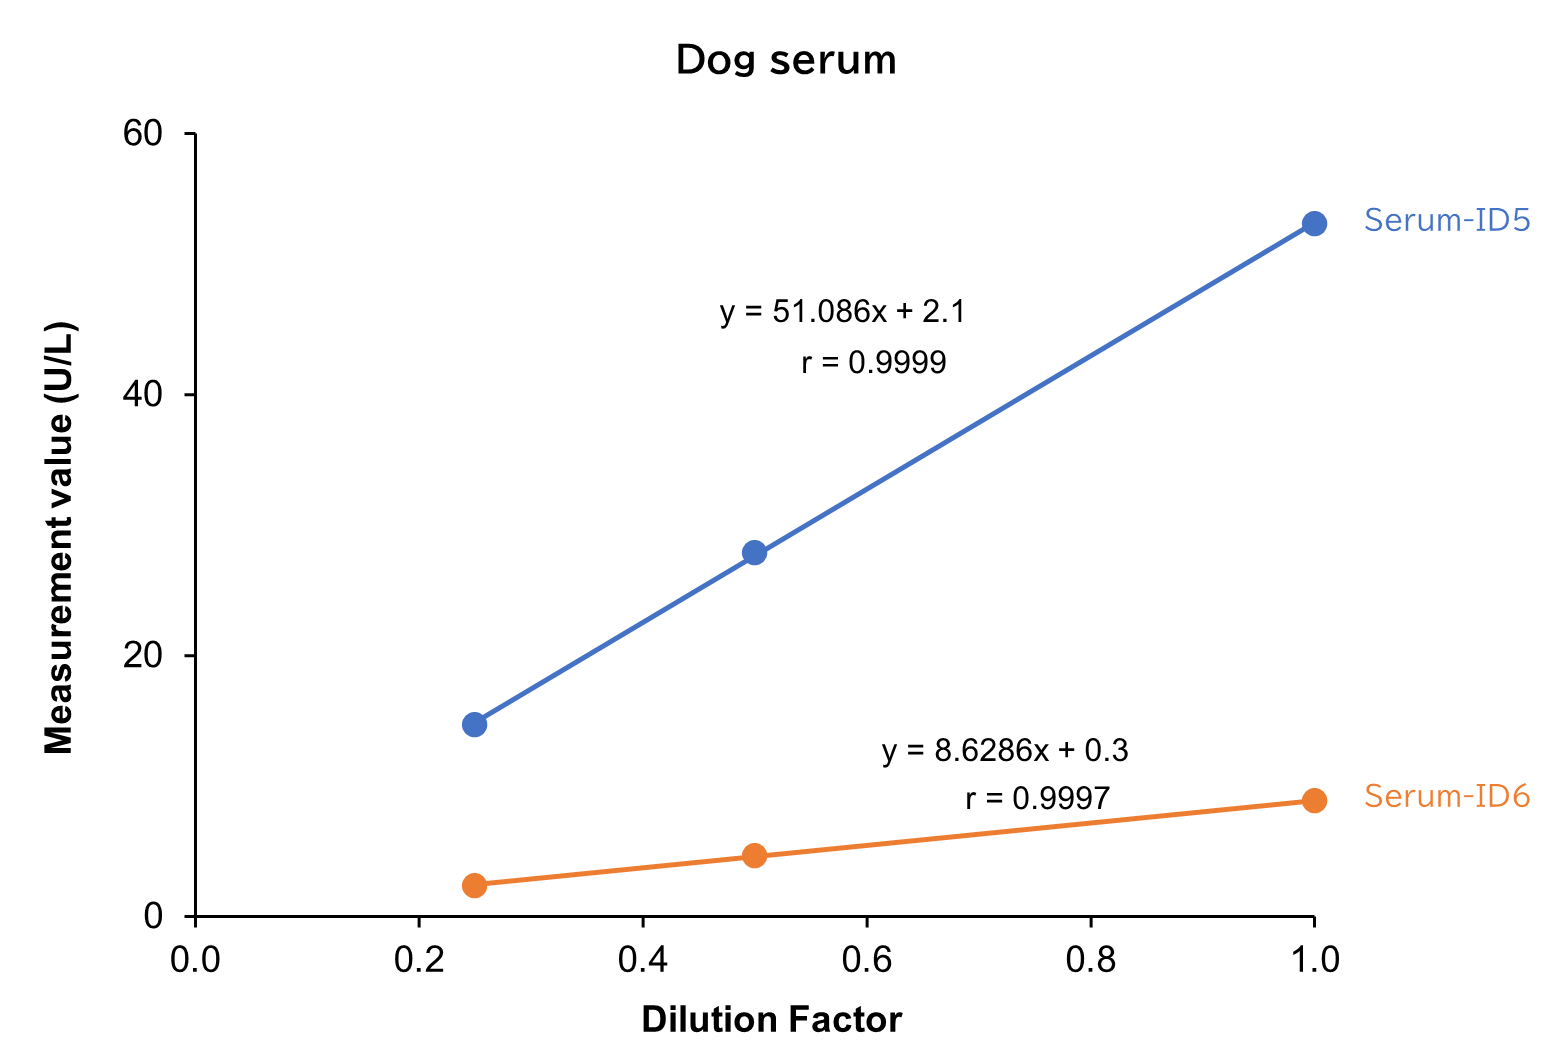
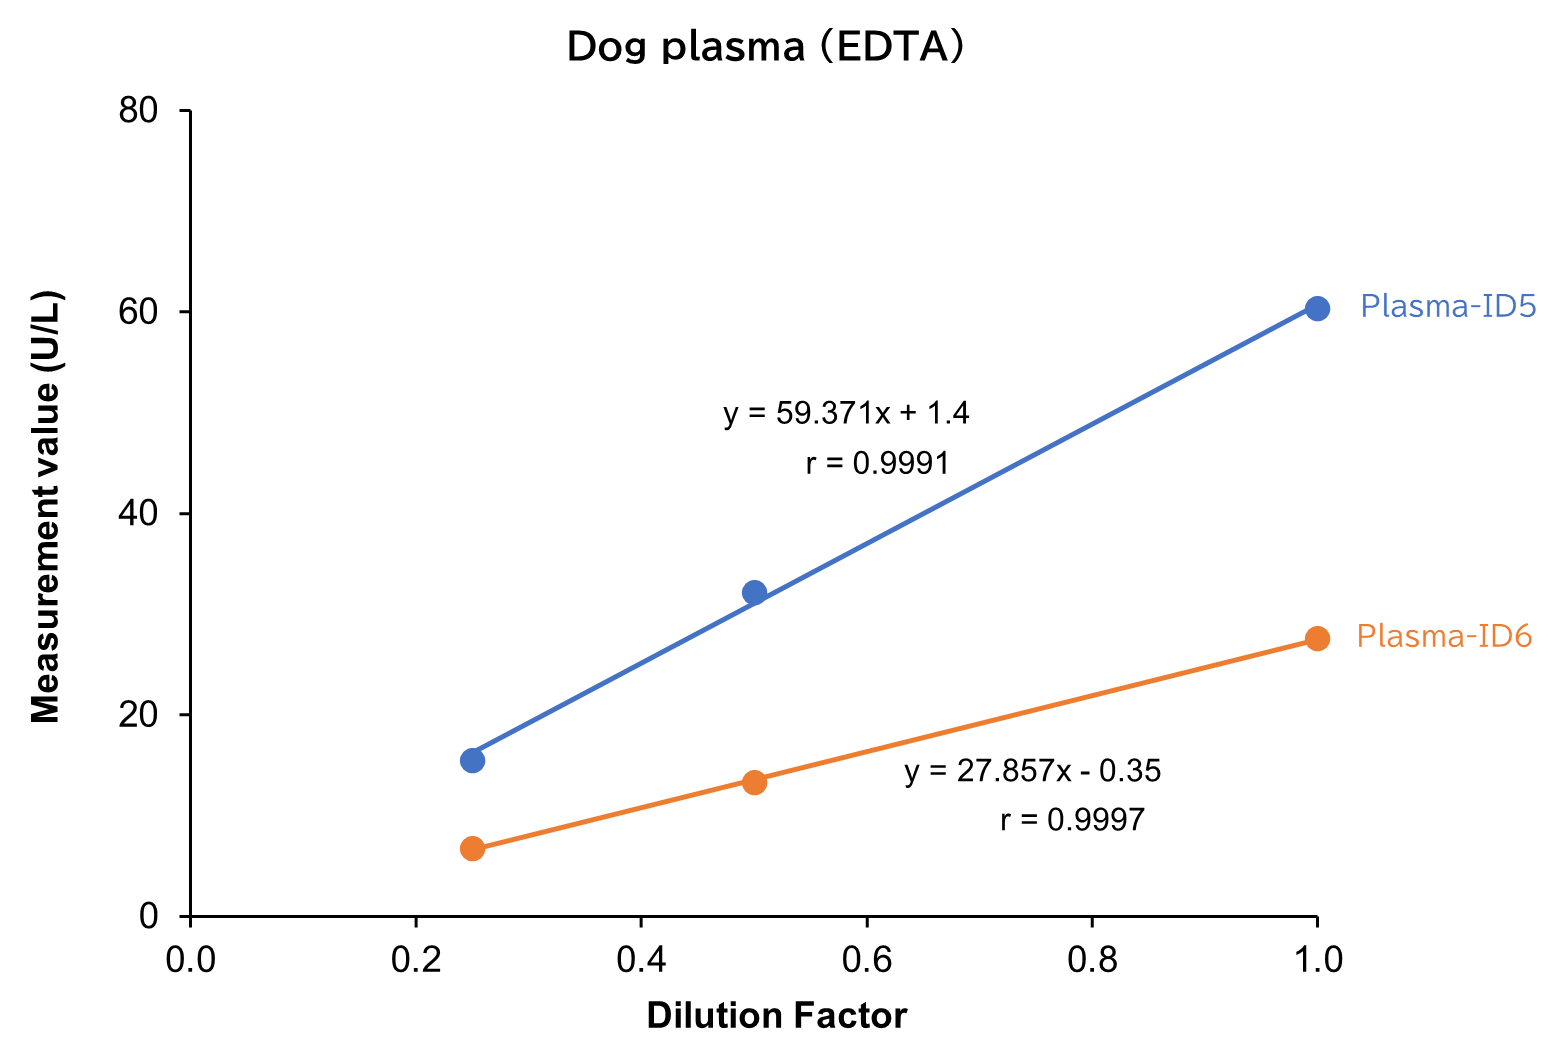
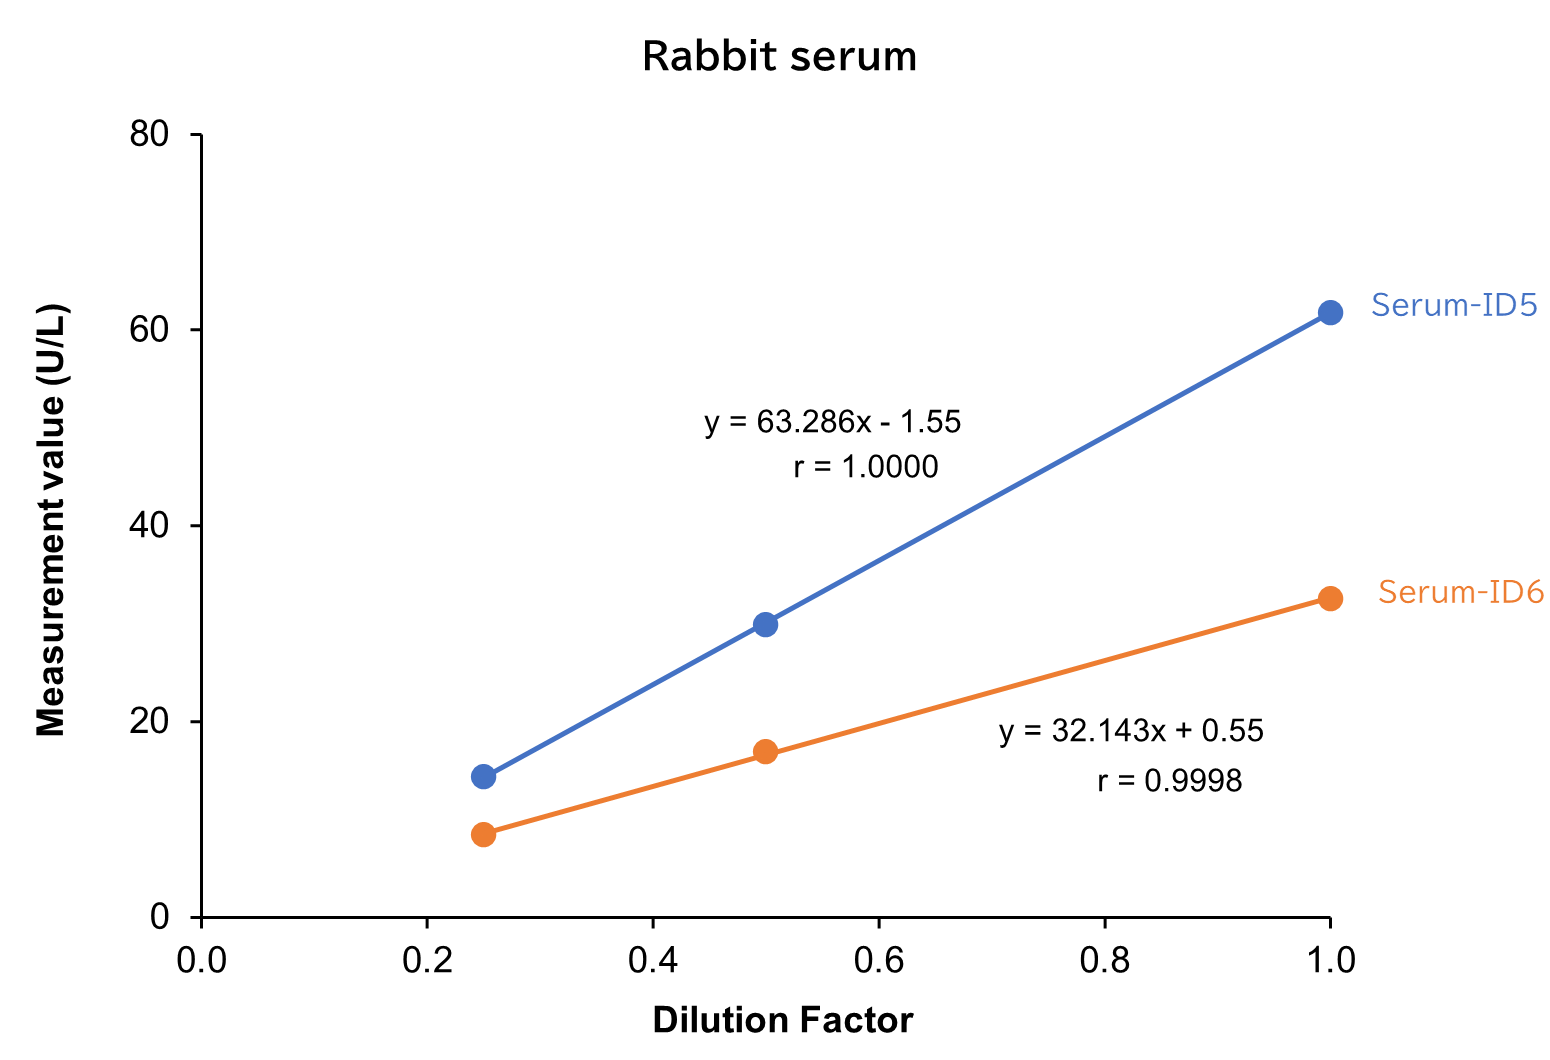
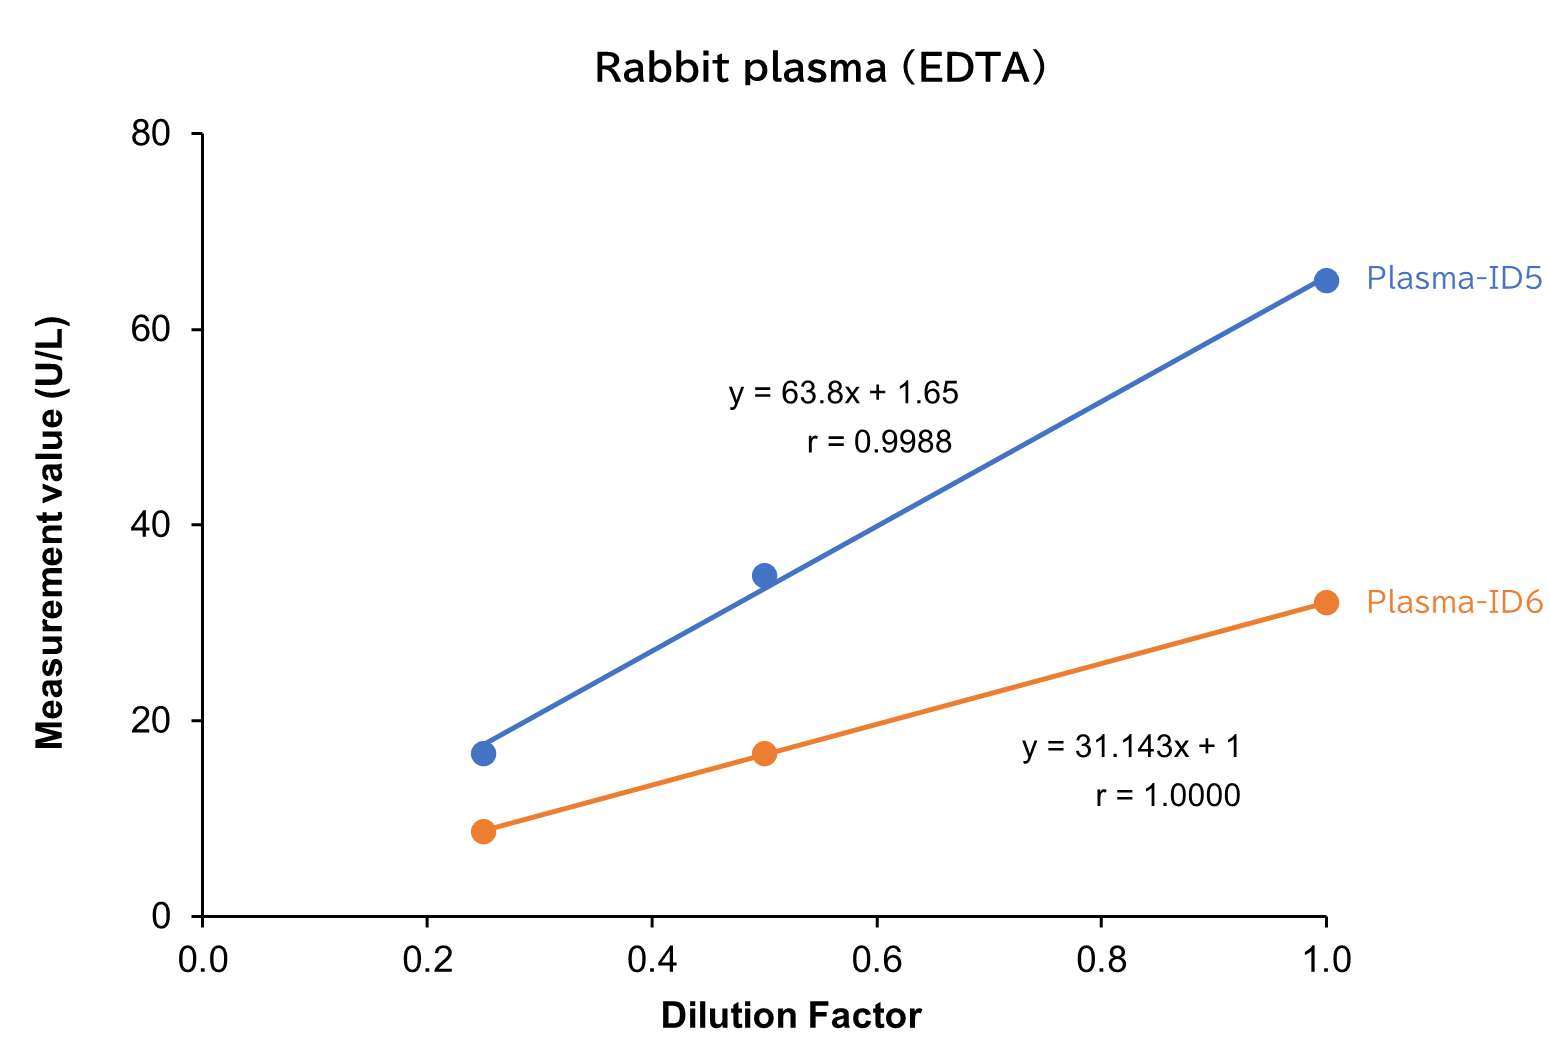
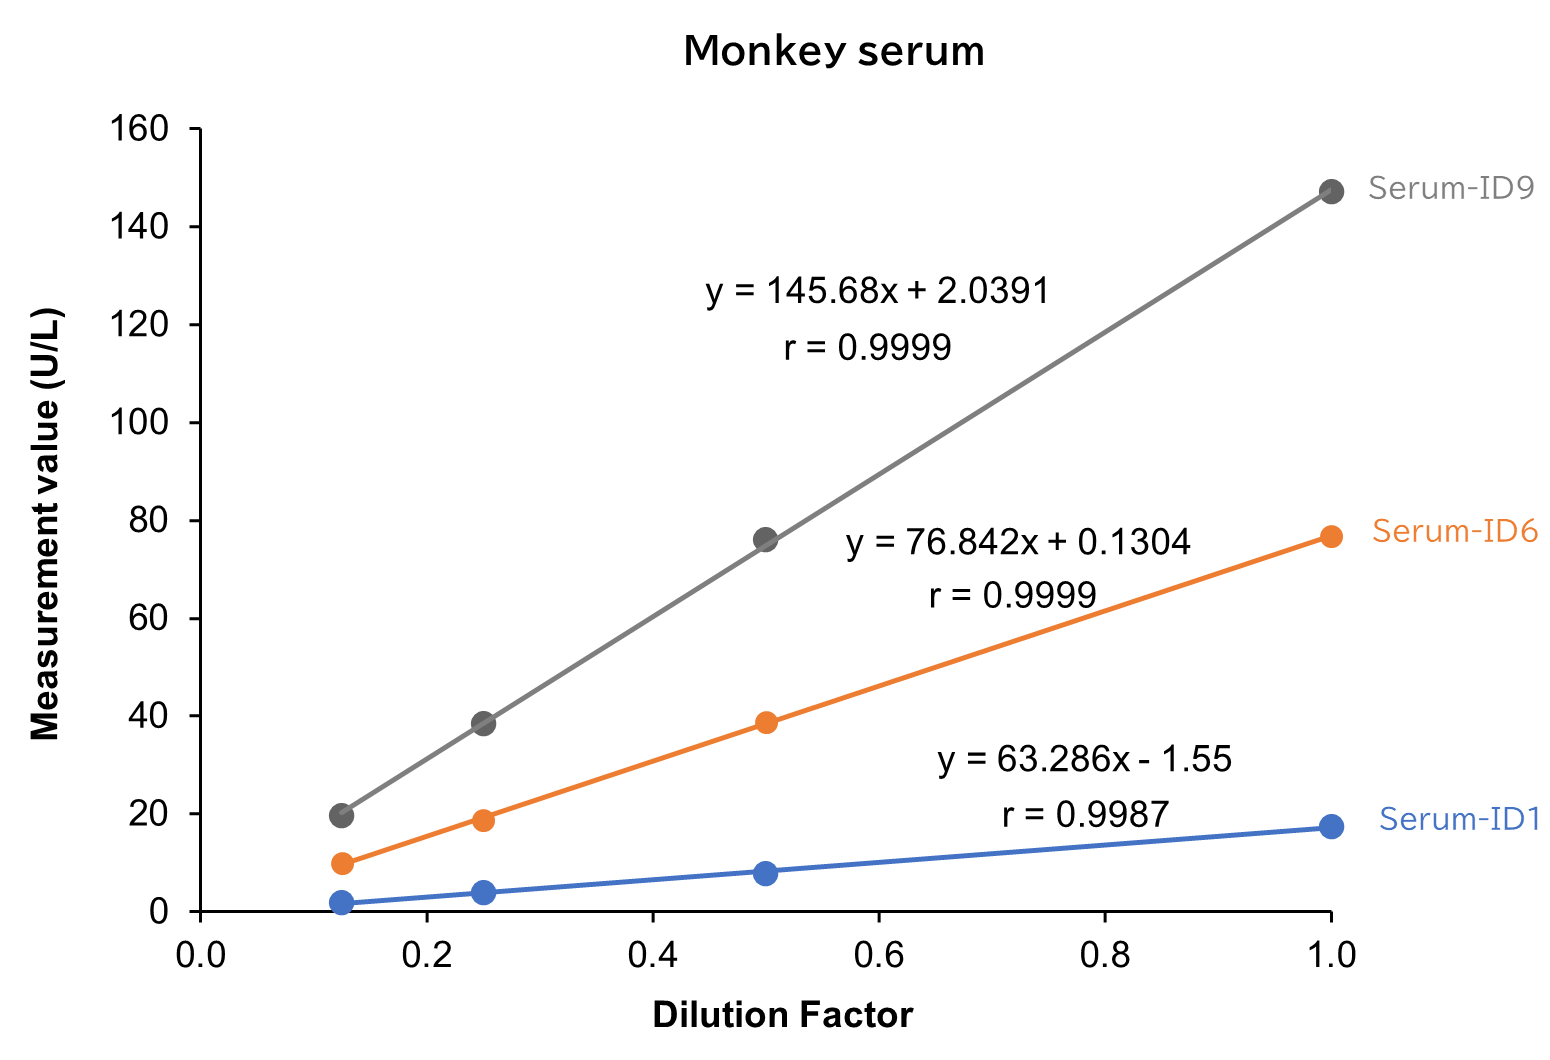
[Result]
All measurement results showed good linearity within the measurement range.
Spike and Recovery Test
Standard solutions at four concentrations were added to serum/plasma (EDTA) from human, mouse, rat, dog and rabbit as well as standard solutions at three concentrations were added to serum from monkey. Next, spike recovery tests were conducted, with each measurement performed in duplicate.
Human sample
| Spiked amount (U/L) |
Measurement value (U/L) |
Recovery volume (U/L) |
Recovery rate (%) |
|
|---|---|---|---|---|
| Serum | 0.0 | 5.9 | - | - |
| 5.0 | 10.6 | 4.7 | 94.0 | |
| 10.0 | 15.7 | 9.8 | 98.0 | |
| 25.0 | 31.5 | 25.6 | 102 | |
| 50.0 | 58.2 | 52.3 | 105 | |
| Average | 99.8 | |||
| Plasma (EDTA) |
0.0 | 1.1 | - | - |
| 5.0 | 6.1 | 5.0 | 100 | |
| 10.0 | 10.9 | 9.8 | 98.0 | |
| 25.0 | 27.5 | 26.4 | 106 | |
| 50.0 | 52.8 | 51.7 | 103 | |
| Average | 102 | |||
Mouse sample
| Spiked amount (U/L) |
Measurement value (U/L) |
Recovery volume (U/L) |
Recovery rate (%) |
|
|---|---|---|---|---|
| Serum | 0.0 | 6.3 | - | - |
| 5.0 | 11.2 | 4.9 | 98.0 | |
| 10.0 | 16.1 | 9.8 | 98.0 | |
| 25.0 | 30.9 | 24.6 | 98.4 | |
| 50.0 | 58.4 | 52.1 | 104 | |
| Average | 99.7 | |||
| Plasma (EDTA) |
0.0 | 19.0 | - | - |
| 5.0 | 24.0 | 5.0 | 100 | |
| 10.0 | 29.0 | 10.0 | 100 | |
| 25.0 | 44.8 | 25.8 | 103 | |
| 50.0 | 70.6 | 51.6 | 103 | |
| Average | 102 | |||
Rat sample
| Spiked amount (U/L) |
Measurement value (U/L) |
Recovery volume (U/L) |
Recovery rate (%) |
|
|---|---|---|---|---|
| Serum | 0.0 | 13.0 | - | - |
| 5.0 | 18.2 | 5.2 | 104 | |
| 10.0 | 23.4 | 10.4 | 104 | |
| 25.0 | 39.5 | 26.5 | 106 | |
| 50.0 | 67.1 | 54.1 | 108 | |
| Average | 106 | |||
| Plasma (EDTA) |
0.0 | 2.8 | ||
| 5.0 | 8.3 | 5.5 | 110 | |
| 10.0 | 13.7 | 10.9 | 109 | |
| 25.0 | 30.4 | 27.6 | 110 | |
| 50.0 | 57.4 | 54.6 | 109 | |
| Average | 110 | |||
Dog sample
| Spiked amount (U/L) |
Measurement value (U/L) |
Recovery volume (U/L) |
Recovery rate (%) |
|
|---|---|---|---|---|
| Serum | 0.0 | 9.4 | - | - |
| 5.0 | 14.5 | 5.1 | 102 | |
| 10.0 | 19.8 | 10.4 | 104 | |
| 25.0 | 34.7 | 25.3 | 101 | |
| 50.0 | 61.4 | 52.0 | 104 | |
| Average | 103 | |||
| Plasma (EDTA) |
0.0 | 4.1 | - | - |
| 5.0 | 9.3 | 5.2 | 104 | |
| 10.0 | 14.5 | 10.4 | 104 | |
| 25.0 | 29.9 | 25.8 | 103 | |
| 50.0 | 56.4 | 52.3 | 105 | |
| Average | 104 | |||
Rabbit sample
| Spiked amount (U/L) |
Measurement value (U/L) |
Recovery volume (U/L) |
Recovery rate (%) |
|
|---|---|---|---|---|
| Serum | 0.0 | 11.6 | - | - |
| 5.0 | 16.8 | 5.2 | 104 | |
| 10.0 | 21.7 | 10.1 | 101 | |
| 25.0 | 36.5 | 24.9 | 99.6 | |
| 50.0 | 62.8 | 51.2 | 102 | |
| Average | 102 | |||
| Plasma (EDTA) |
0.0 | 19.6 | - | - |
| 5.0 | 24.7 | 5.1 | 102 | |
| 10.0 | 29.7 | 10.1 | 101 | |
| 25.0 | 45.3 | 25.7 | 103 | |
| 50.0 | 71.0 | 51.4 | 103 | |
| Average | 102 | |||
Monkey sample
| Spiked amount (U/L) |
Measurement value (U/L) |
Recovery volume (U/L) |
Recovery rate (%) |
|
|---|---|---|---|---|
| Serum | 0.0 | 50.4 | - | - |
| 22.6 | 73.3 | 22.9 | 101 | |
| 45.1 | 90.7 | 40.3 | 89.4 | |
| 90.3 | 132.6 | 82.2 | 91.0 | |
| Average | 93.9 | |||
[Result]
Good recovery rates were confirmed.
Correlation with the Previous Version of the Kit
GLDH levels in rat serum and plasma were measured using LabAssay™ GLDH (AA Type) (this assay kit) and LabAssay™ GLDH-Rat (A Type) (Product No. 291-93401; previous kit), and the correlation between the two sets of results was evaluated.
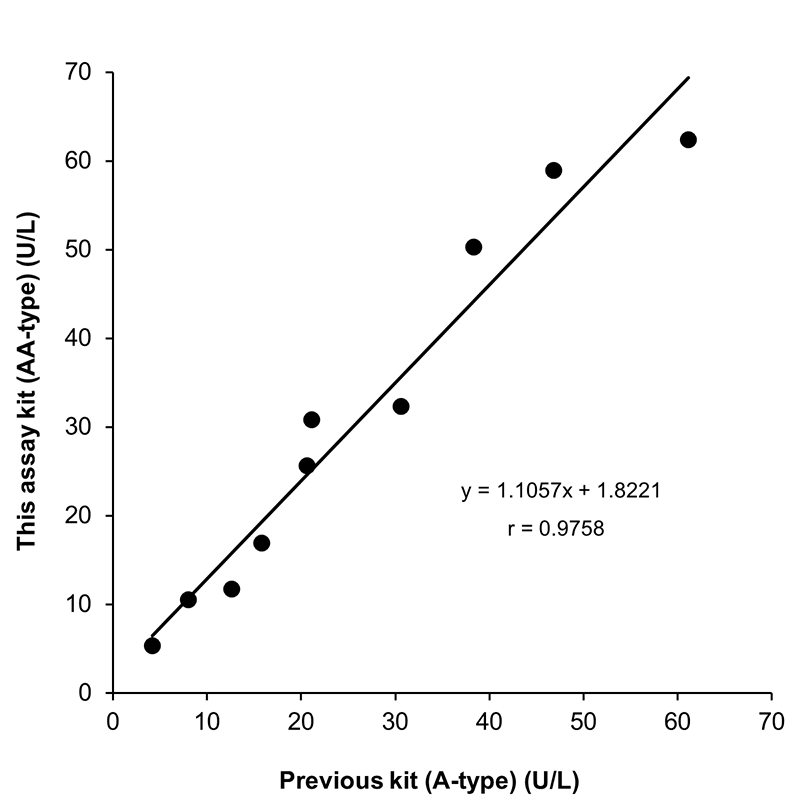
[Result]
A strong correlation was confirmed between the values obtained with this assay kit and those obtained using previous kit.
Correlation with products from other manufacturers
GLDH levels in serum/plasma (EDTA) from human, mouse, rat, dog, and rabbit were measured using LabAssay™ GLDH (AA Type) (this assay kit) and GLDH assay reagents from Company A or Company B, and the correlation between the measured values was evaluated.
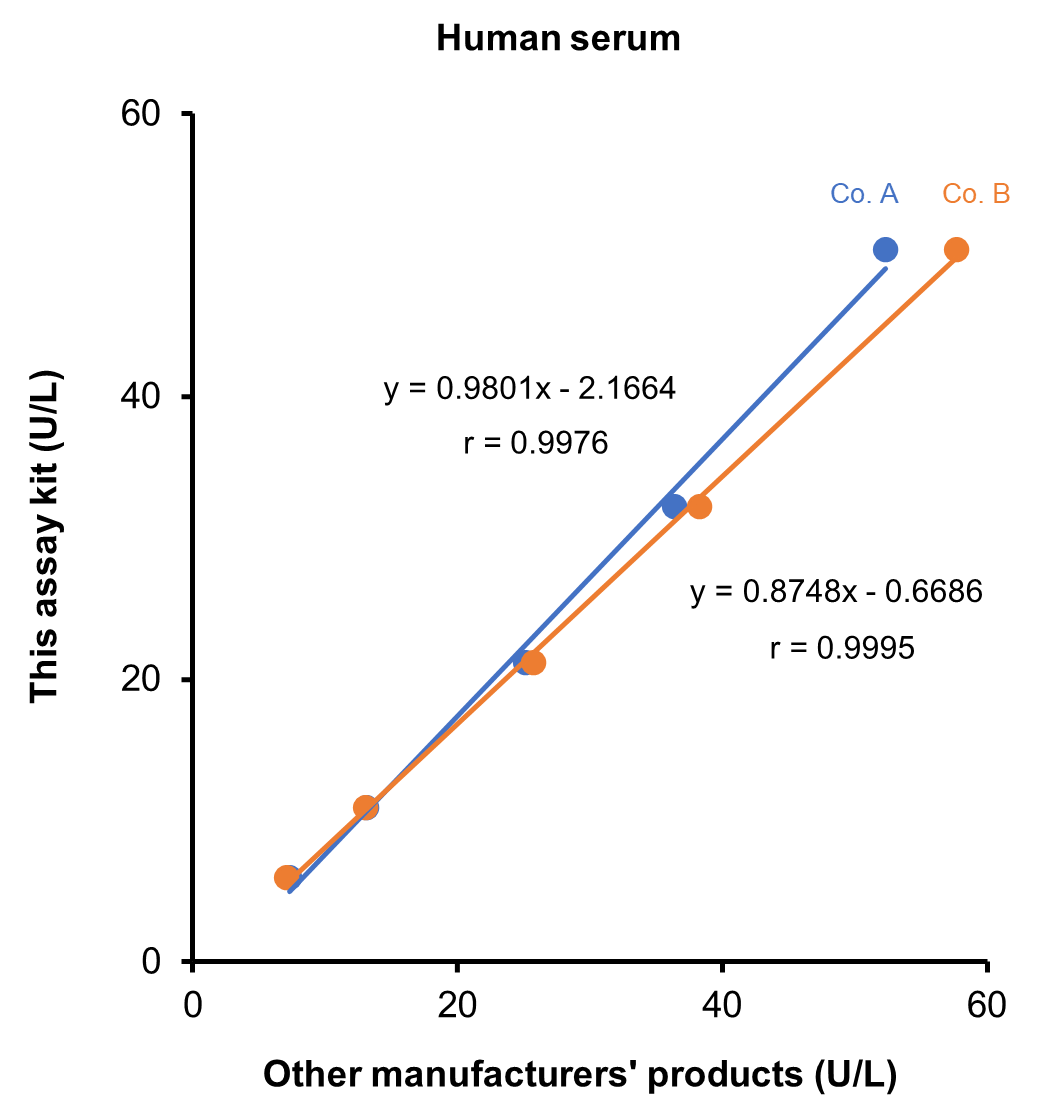
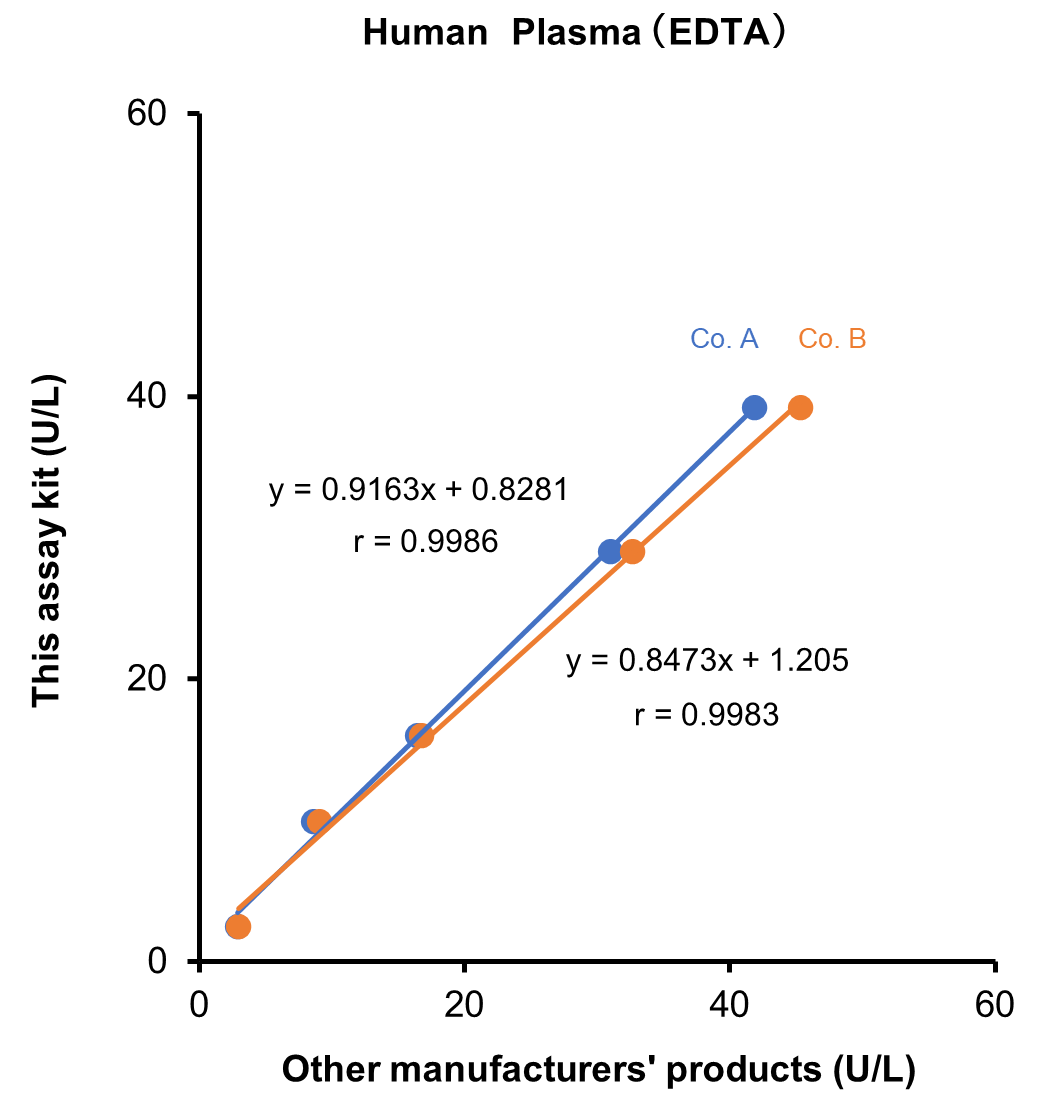
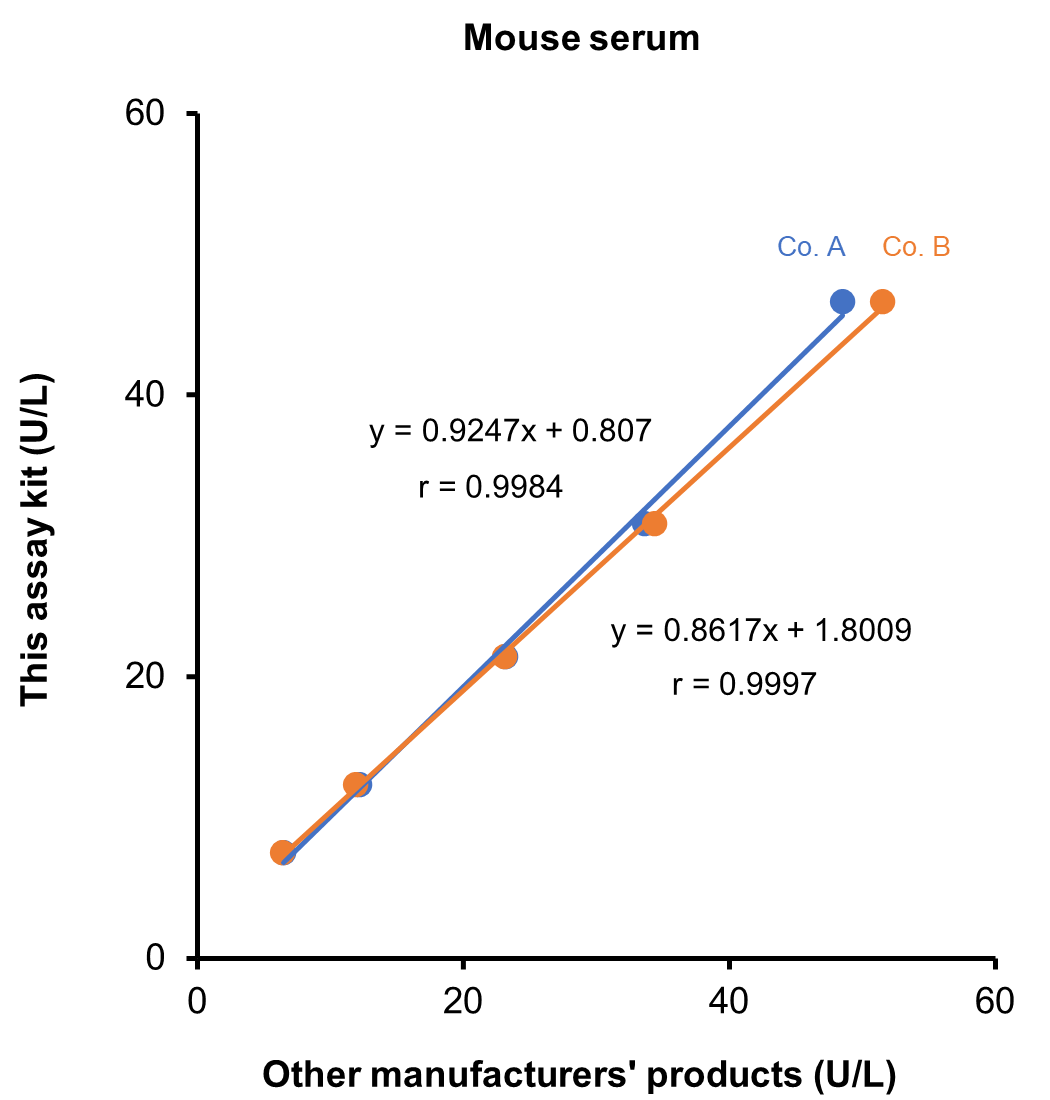
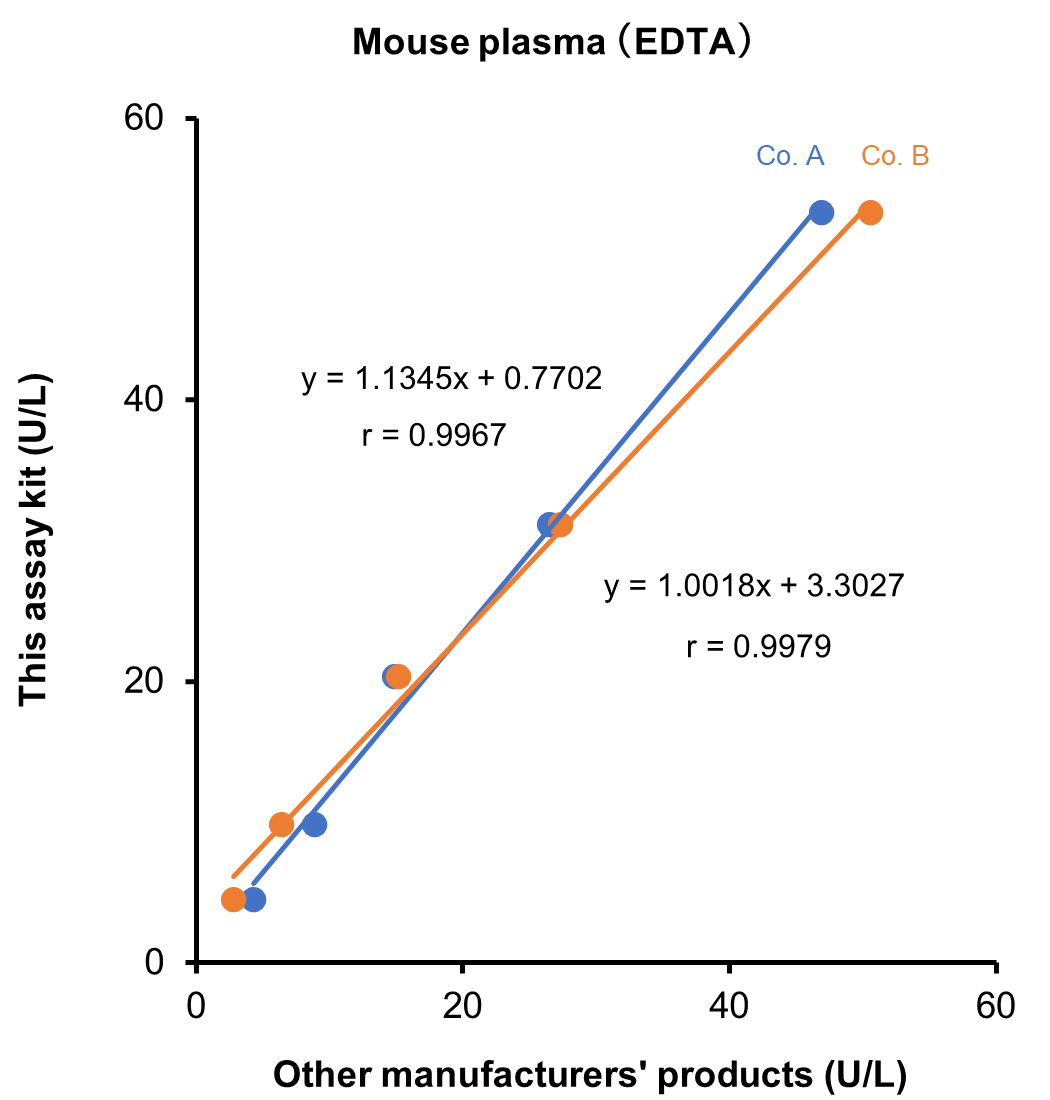
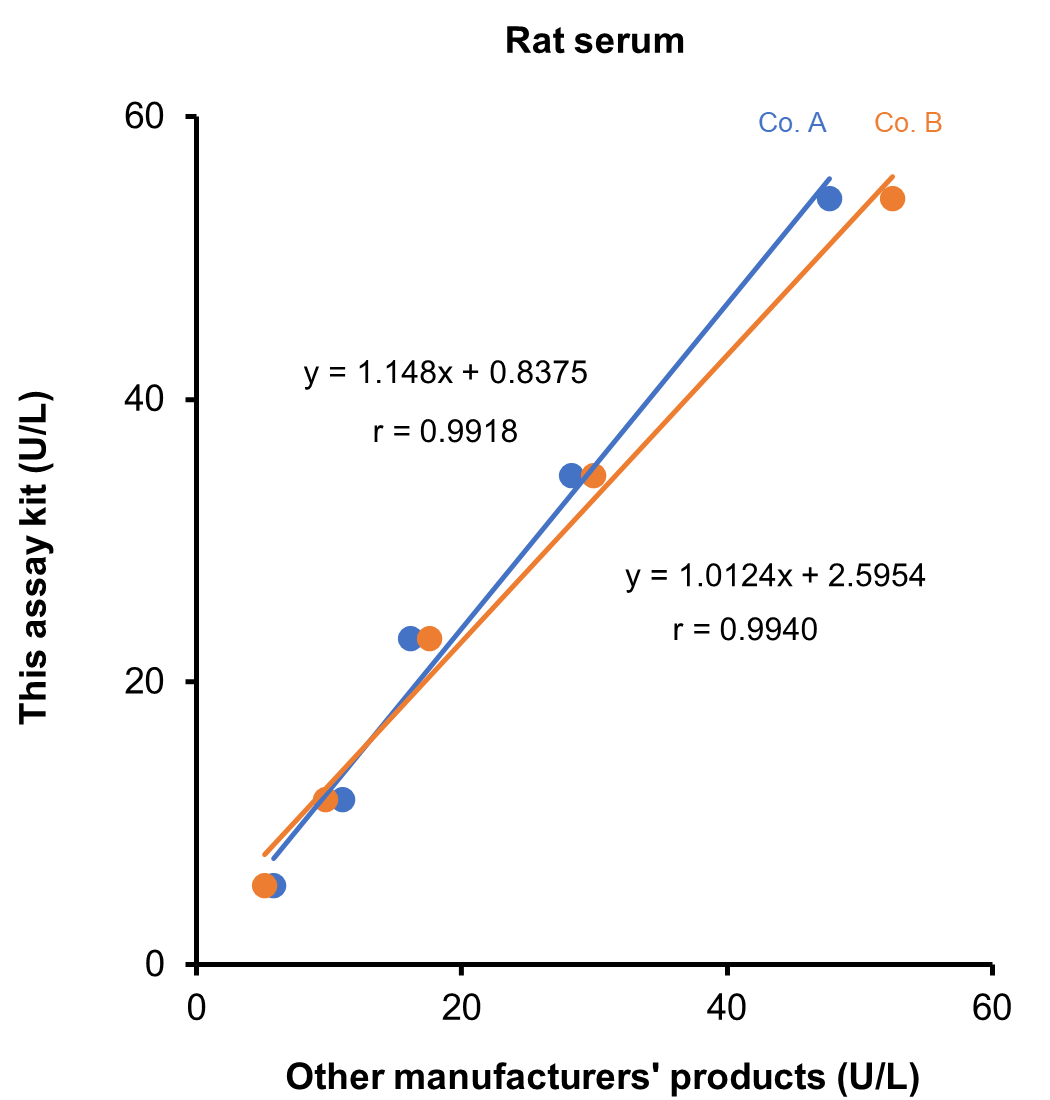
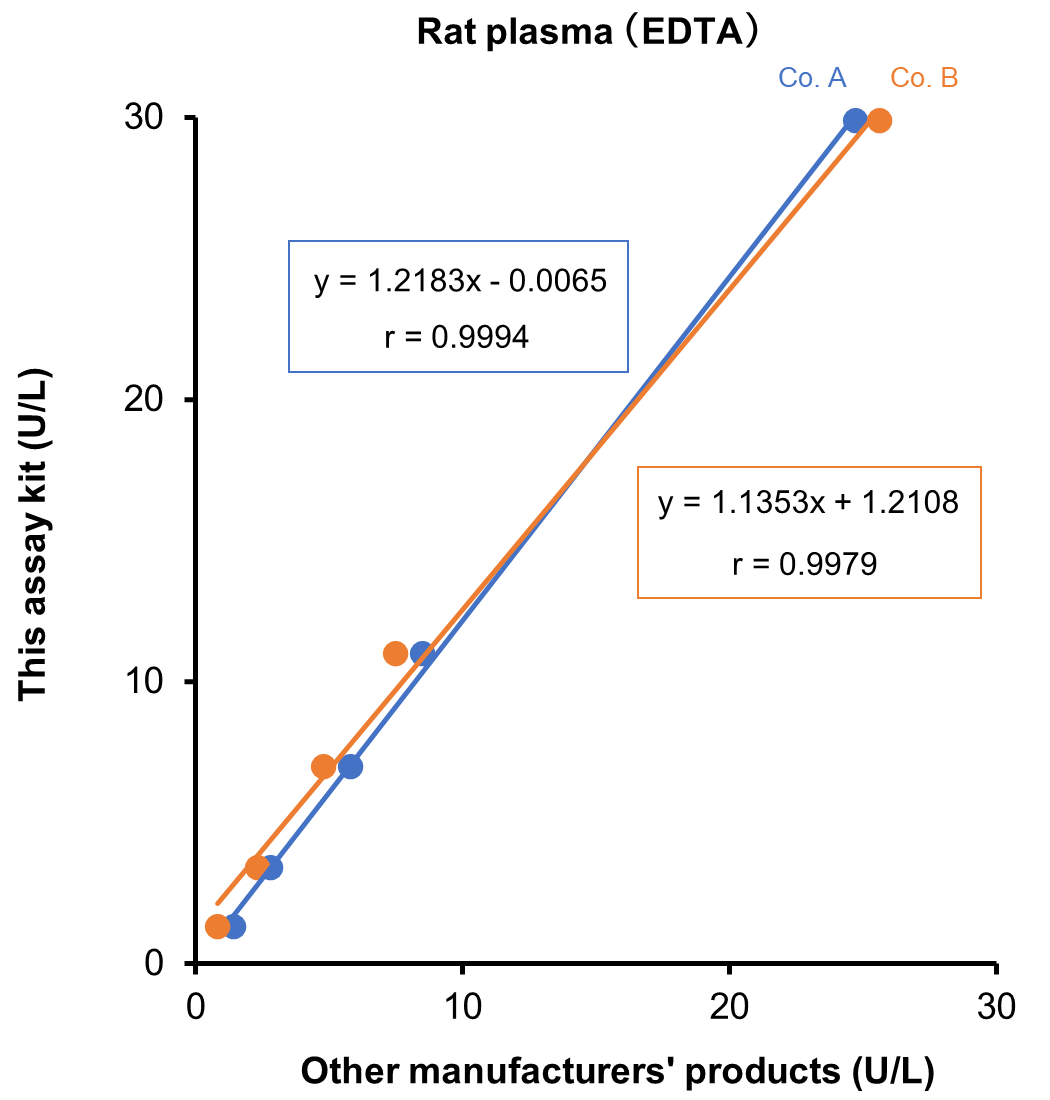
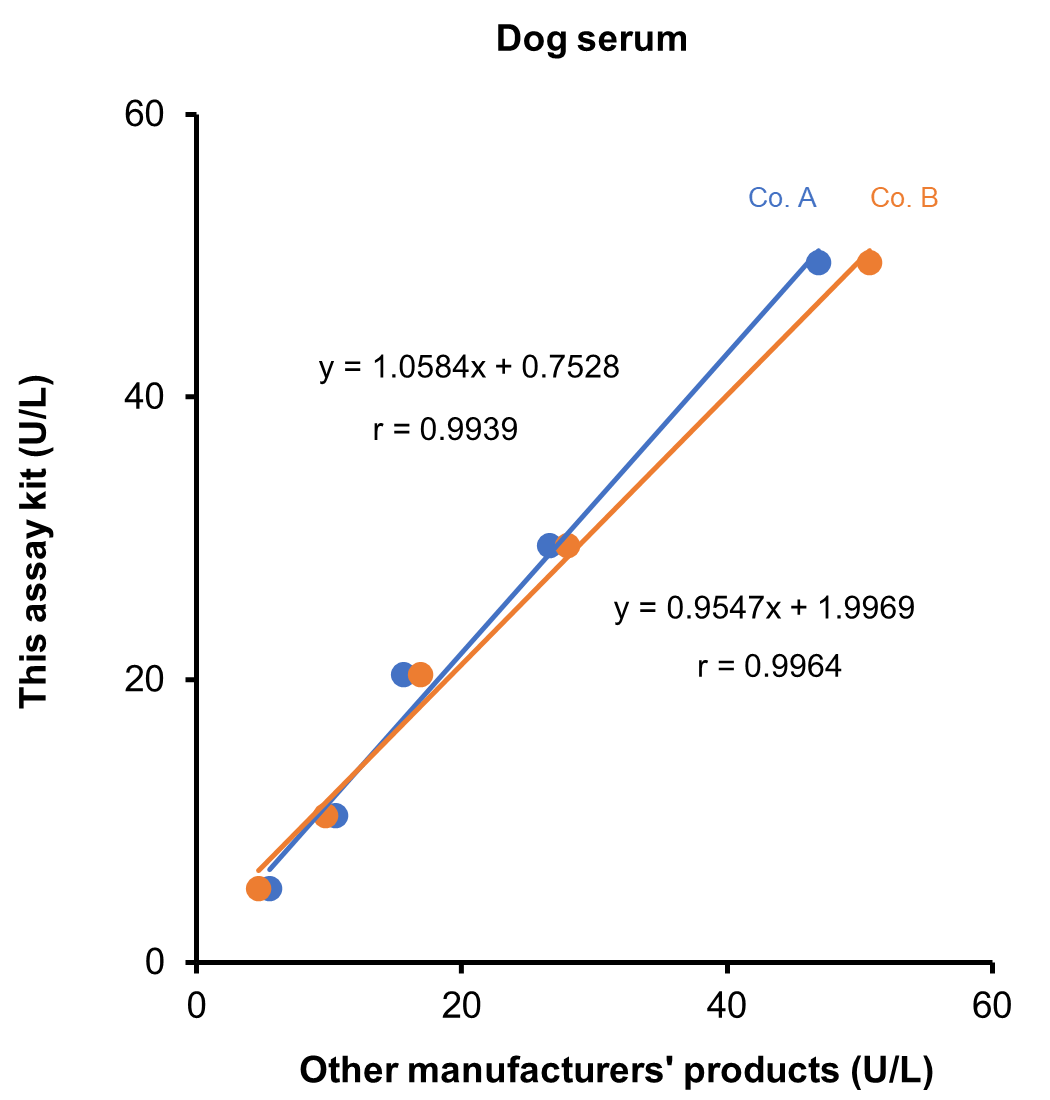
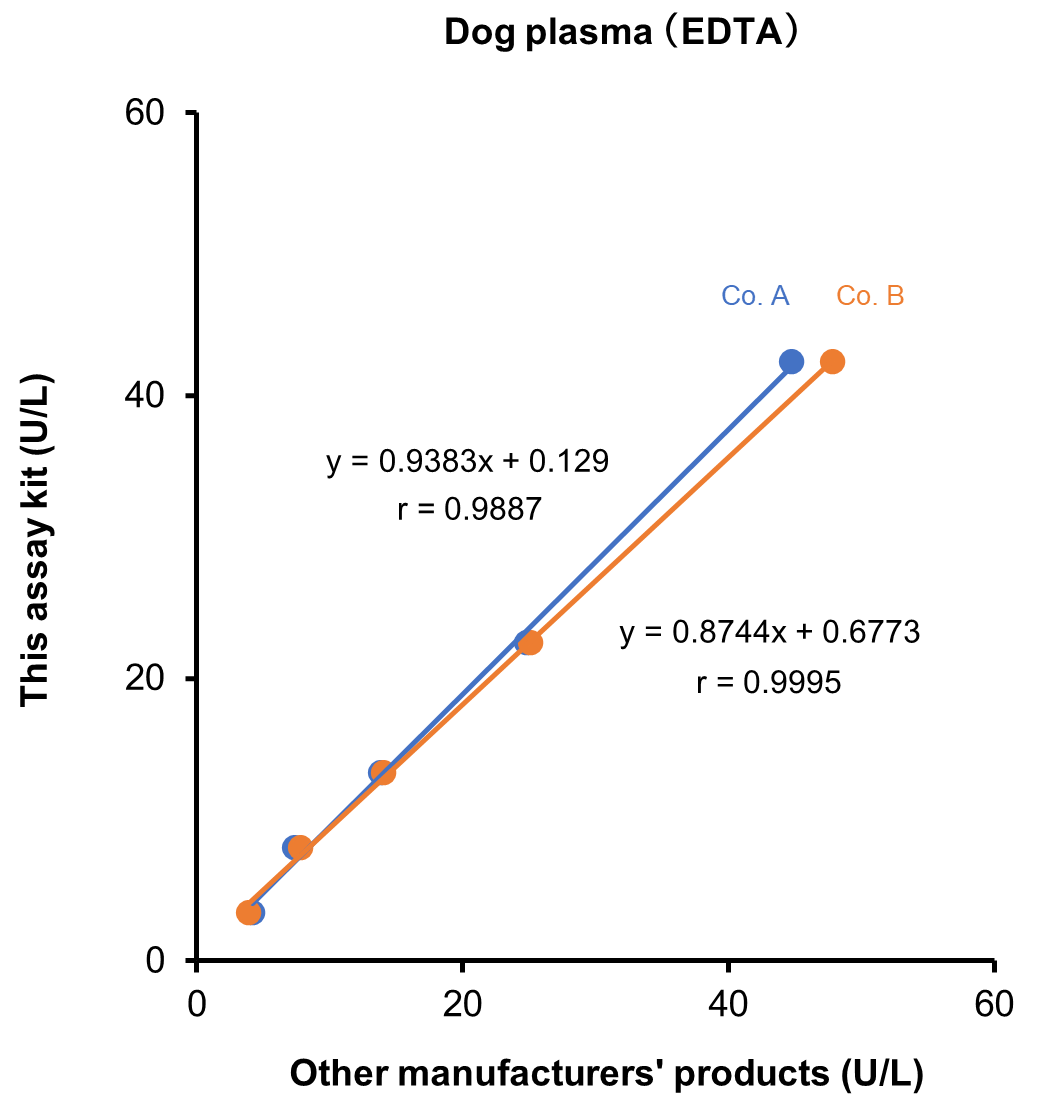
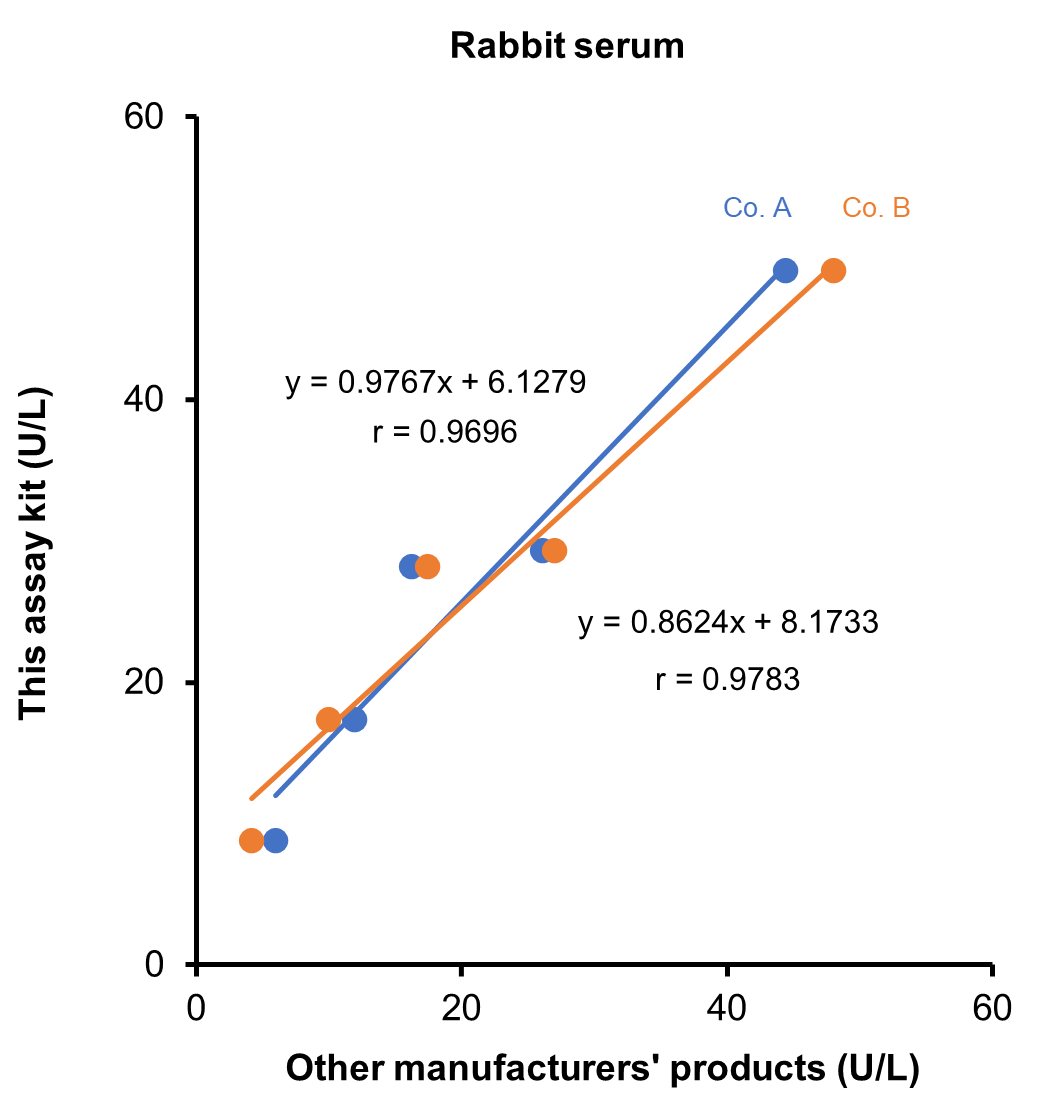
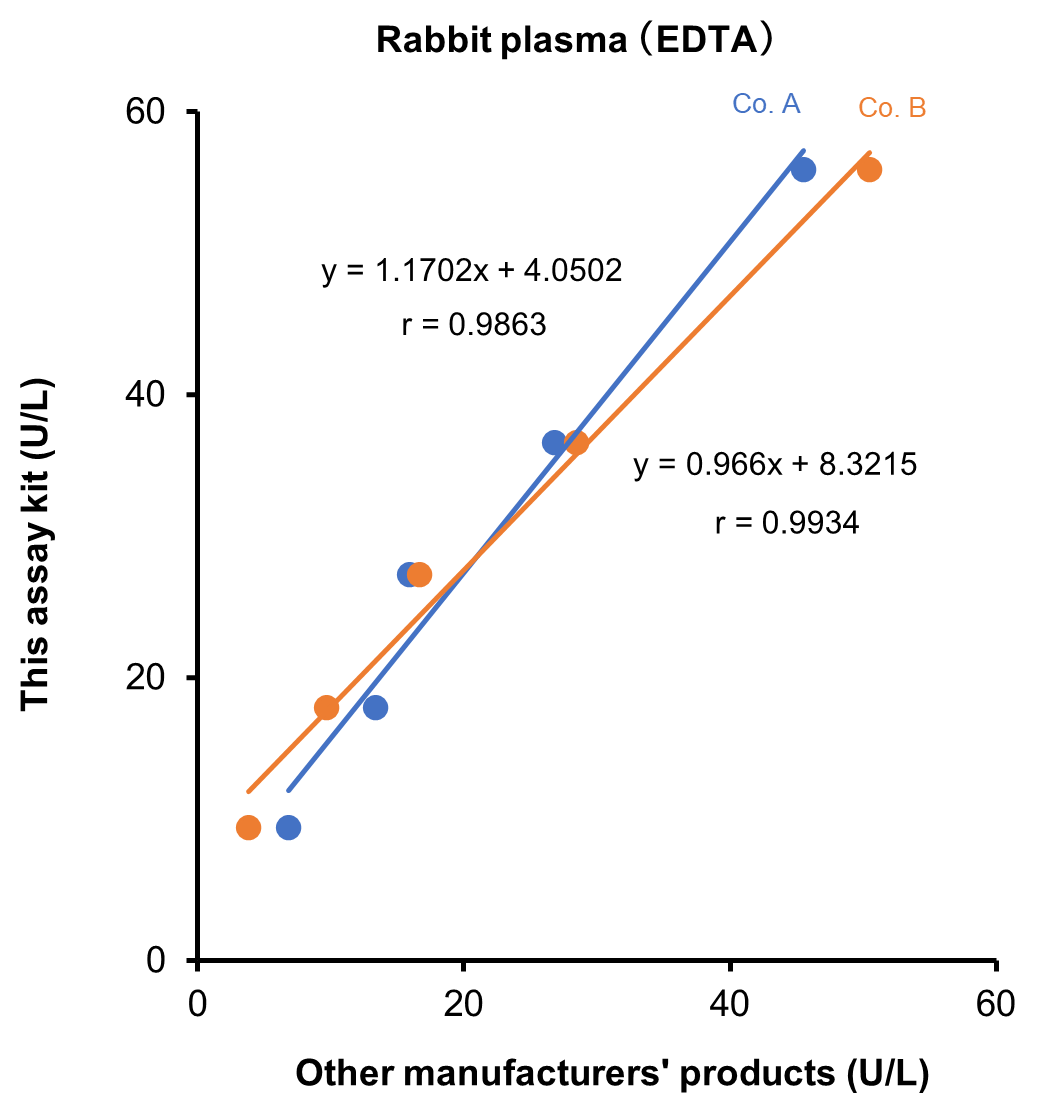
[Result]
A strong correlation was confirmed between the values obtained with LabAssay™ GLDH (AA-type) and those obtained using products from other manufacturers.
Correlation with Other Liver Injury Markers (ALT, AST)
In drug-induced liver injury, GLDH has been shown to strongly correlate with ALT2).
Plasma samples were collected several days after drug administration to mice and rats, and ALT, AST, and GLDH were measured in the same samples. ALT and AST were measured using fresh samples, whereas GLDH was measured after freezing and thawing. Samples exceeding the assay range were diluted tenfold prior to analysis.
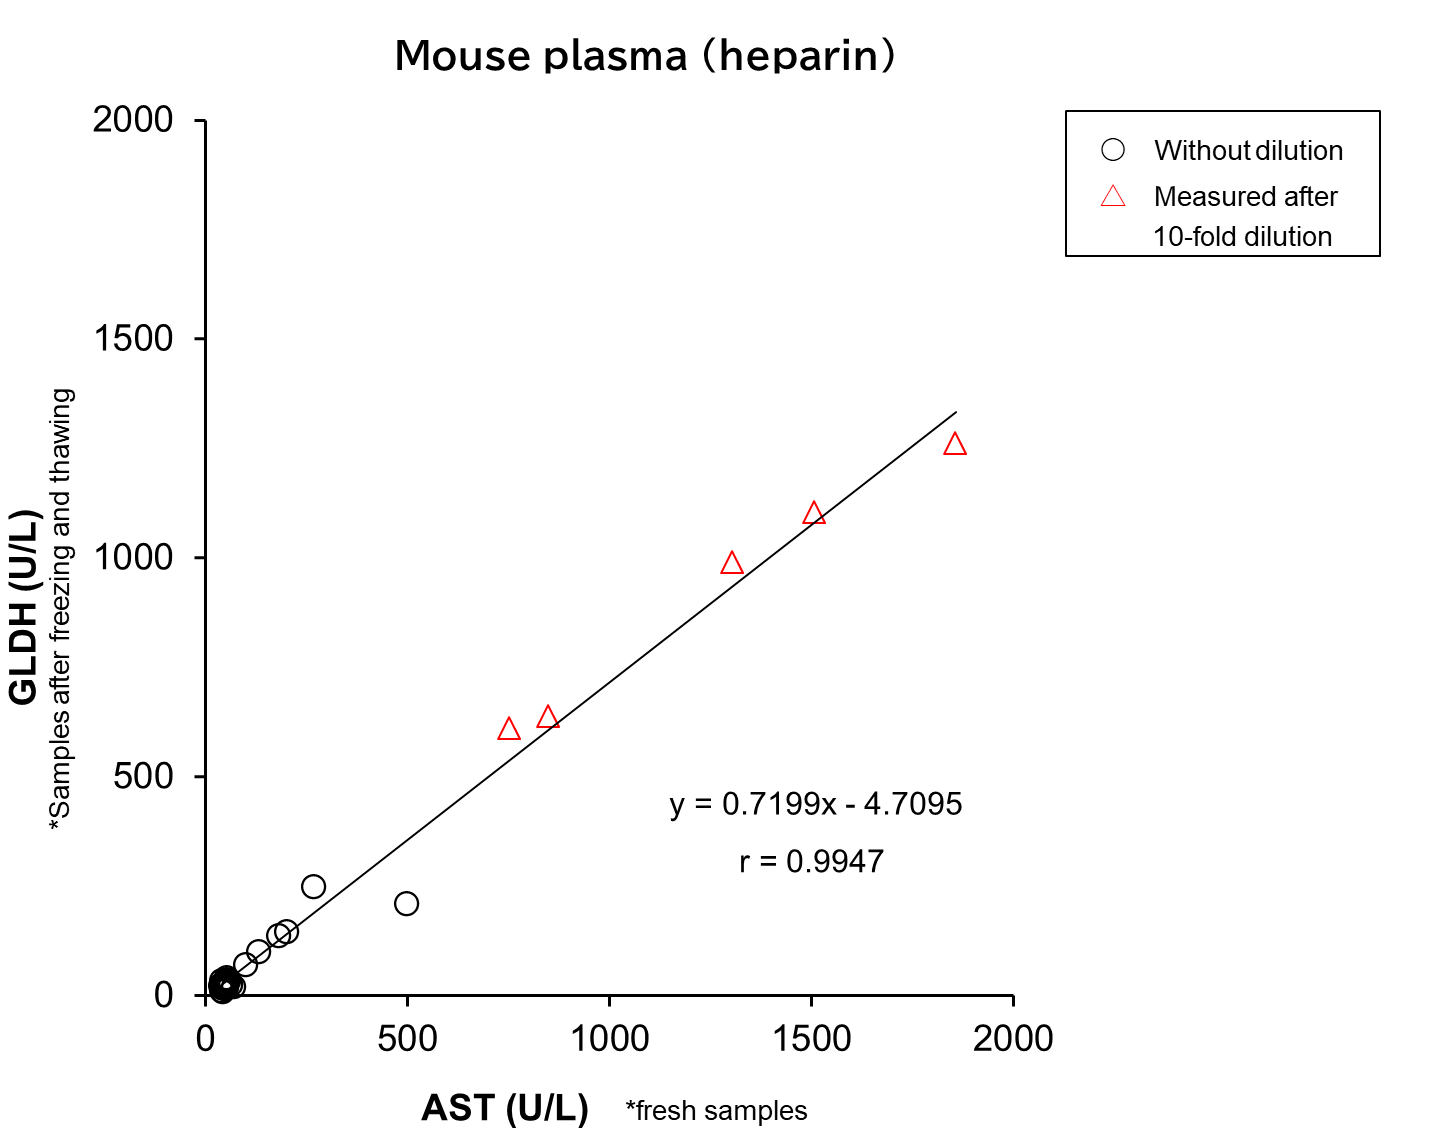
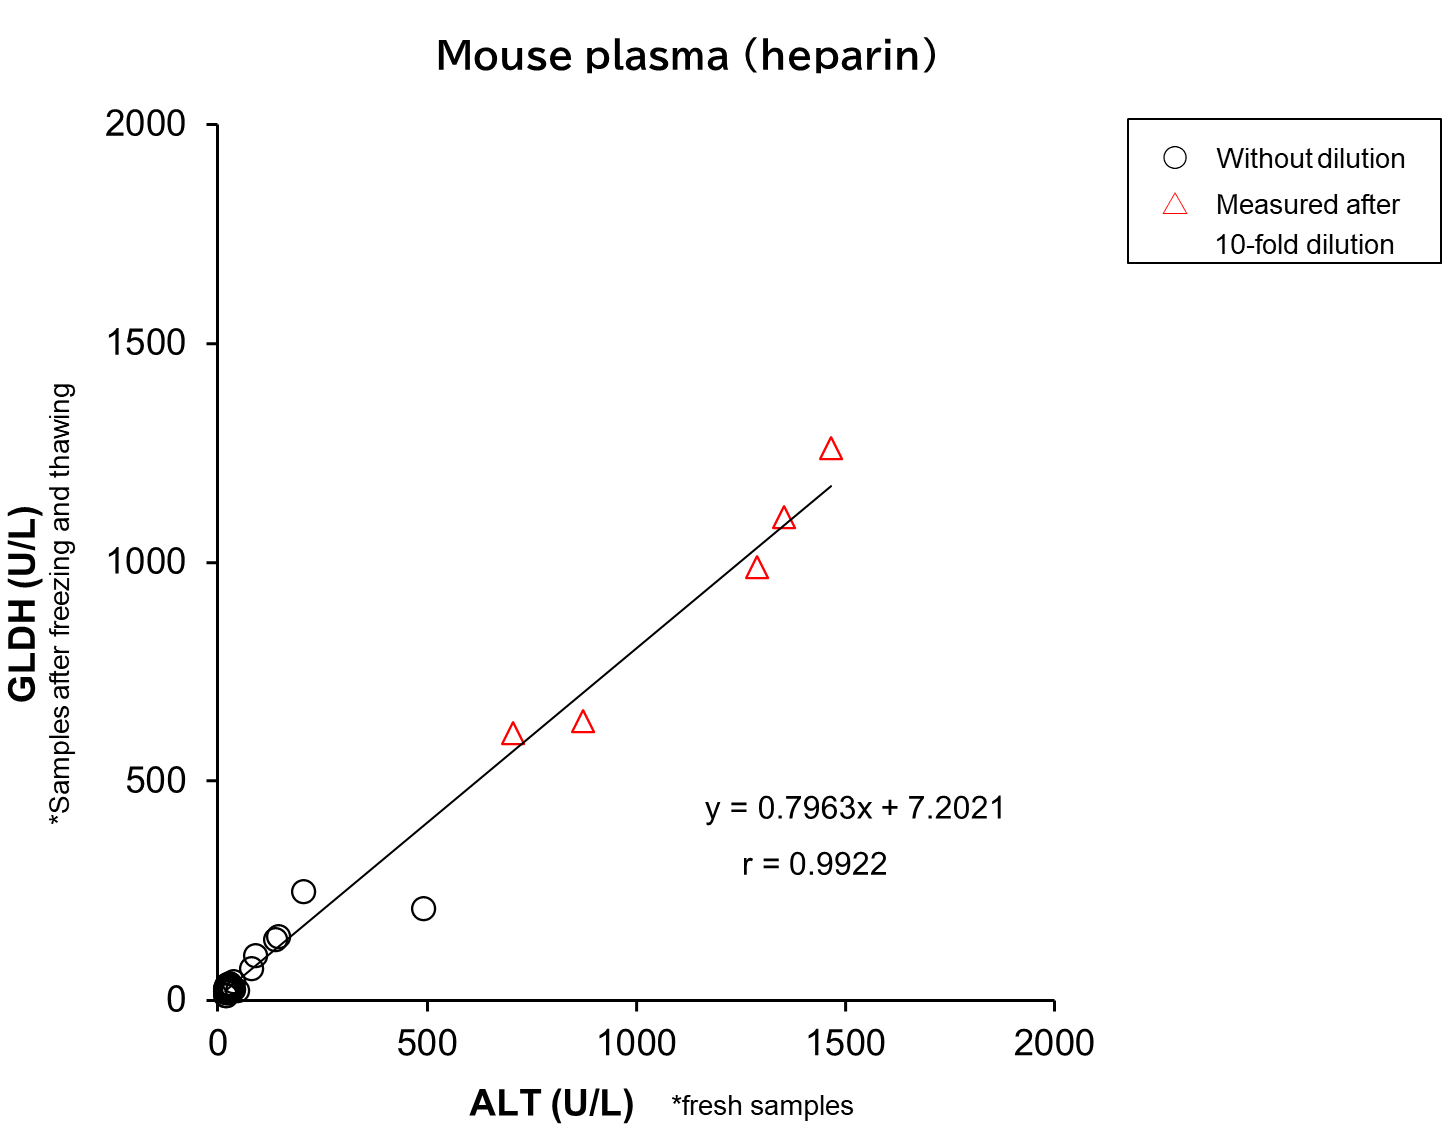
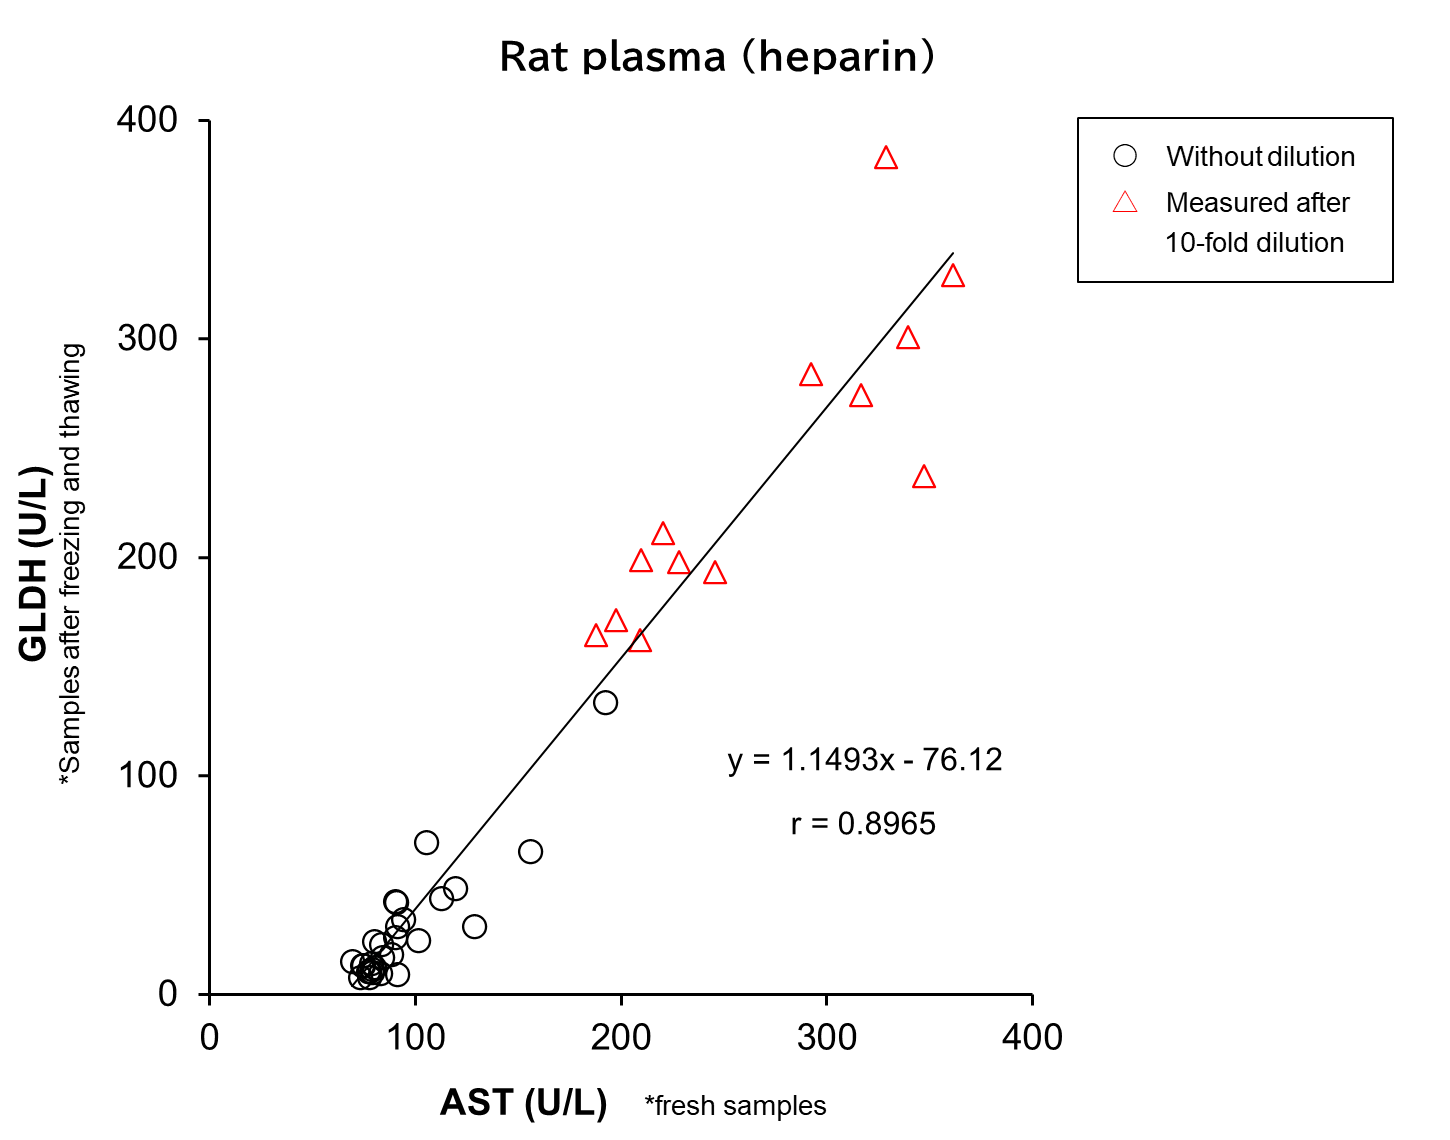
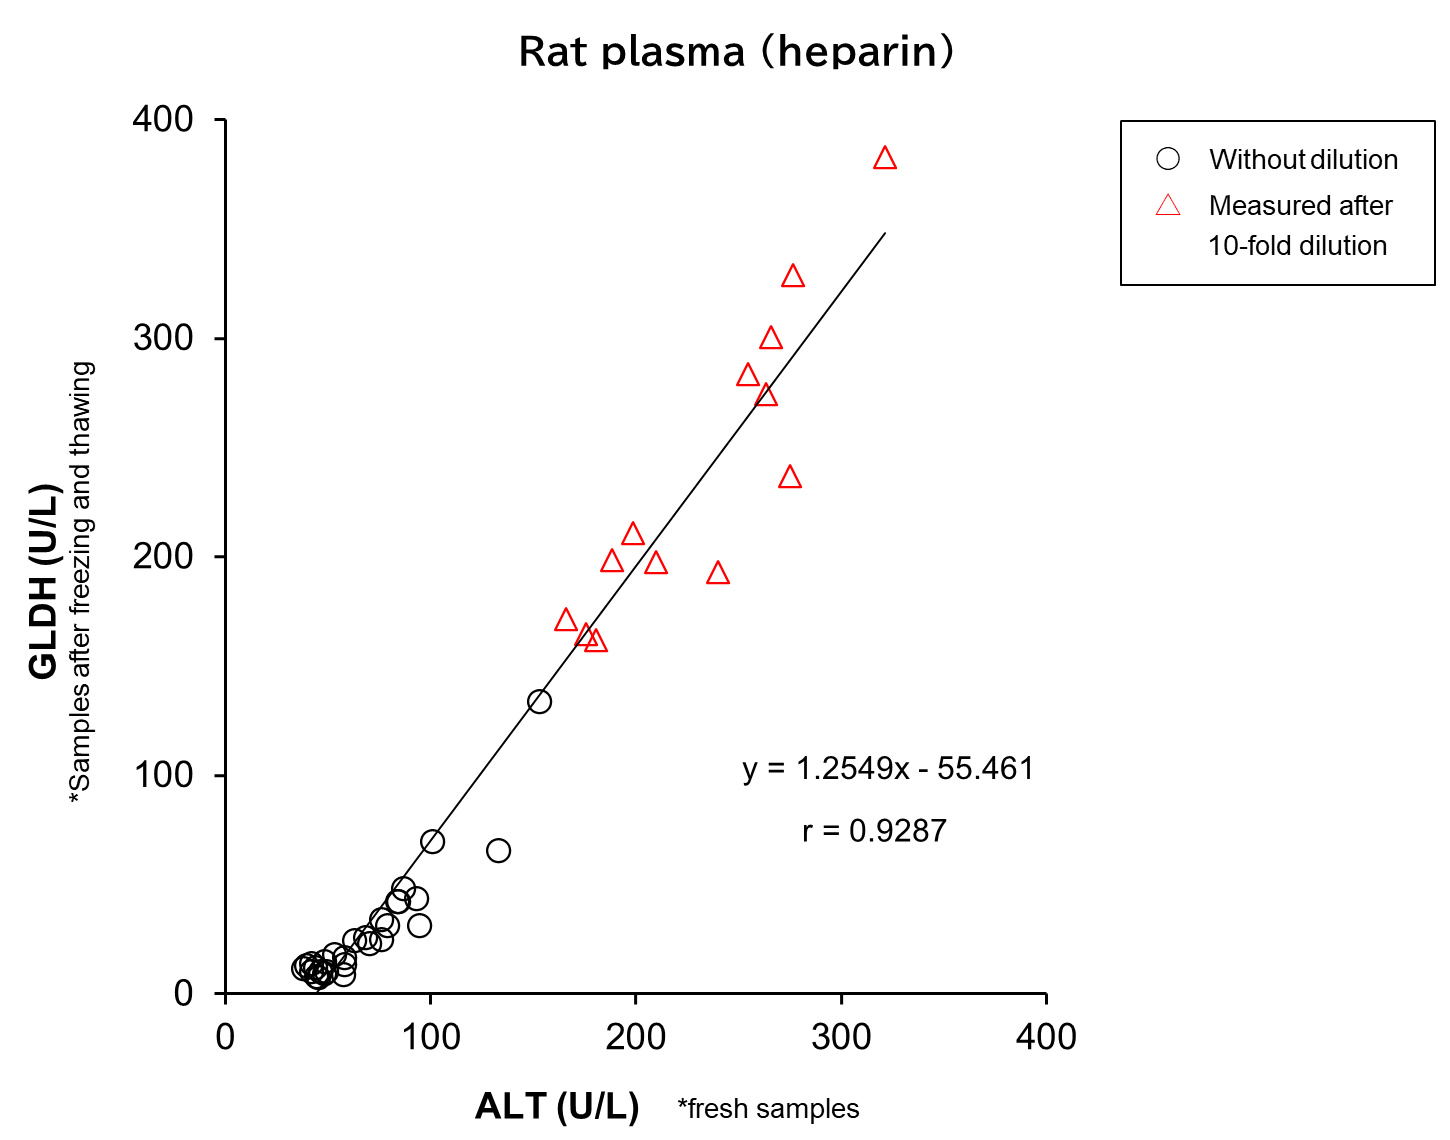
[Result]
GLDH showed a strong correlation with ALT and AST.
[Note]: GLDH was measured using previously frozen samples and should be regarded as reference values only.
Measurement Using Actual Samples
| Animal | Sample* | Measured value (U/L) |
|---|---|---|
| Human | Serum | 5.9 |
| Plasma (EDTA) | 1.1 | |
| Mouse (BALB/c, ♂) |
Serum | 6.3 |
| Plasma (EDTA) | 19.0 | |
| Rat (SD) |
Serum | 13.0 |
| Plasma (EDTA) | 2.8 | |
| Dog (Beagle) |
Serum | 9.4 |
| Plasma (EDTA) | 4.1 | |
| Rabbit (Japanese White Rabbit) |
Serum | 11.6 |
| Plasma (EDTA) | 19.6 | |
| Monkey | Serum | 17.5 |
Reference
- Robert J. H. et al.:, Biomarkers., 5, 22 (2017)
A longitudinal assessment of miR-122 and GLDH as biomarkers of drug-induced liver injury in the rat - Church, R. J. et al.:, Hepatology., 2, 69 (2015)
Candidate biomarkers for the diagnosis and prognosis of drug-induced liver injury: An international collaborative effort.
FAQ
About sample
- How should samples be stored after collection?
- Measure immediately after blood collection or freeze at -35℃ or below for long-term storage.
- Which anticoagulant should be used for plasma samples?
- We have confirmed that EDTA can be used as an anticoagulant. Other anticoagulants have not been evaluated.
- What should I do with samples that exceed the measurable range?
- Dilute specimen with saline and repeat the assay if the measured value exceeds the measurable range, and multiply the result by the dilution factor.
- Is there any influence from substances that interfere with measurement (hemolysis, chyle, ascorbic acid, bilirubin, etc.)?
Please treat the measured values of hemolyzed samples as reference values. Chyle, ascorbic acid, and bilirubin have almost no effect on the measured values. We have confirmed that there is no influence at the following concentrations.
Effects of interfering substances
Hemolysis No influence up to 100 mg/dL Chyle (Formazine Turbidity Unit) No influence up to 400 FTU Ascorbic acid No influence up to 50 mg/dL Bilirubin-F No influence up to 30 mg/dL Bilirubin-C No influence up to 20 mg/dL
About kit usage
- What instruments, and equipment are required for the assay using this kit?
- The instruments and equipment required for the use of this kit are listed below.
- Automated analyzer
- Pipettes with replaceable tips
- Vortex mixer
- Purified water (distilled water)
- Saline solution
- What are the storage conditions and shelf-life guidelines for each reagent?
GLDH Standard
Unopened standards should be stored at 2–10°C. Use immediately after reconstitution. In our internal study, the measurement value changed by -1.6% at room temperature and -5.3% at 4°C after 24 hours following reconstitution. The dissolved GLDH standard solution (60.0 U/L) can be aliquoted into microtubes and stored frozen at -35°C or below. Please use it within 45 days after freezing. Do not refreeze the GLDH standard solution after thawing.Example of Post-Thaw Stability Study
0 hr 4 hr 8 hr 24 hr Measurement
value (U/L)Measurement
value (U/L)Change ratio
(%)Measurement
value (U/L)Change ratio
(%)Measurement
value (U/L)Change ratio
(%)Store at room
temperature62.3 62.1 -0.32 61.1 -1.9 61.3 -1.6 Store at 4℃ - 60.6 -2.7 59.4 -4.7 59.0 -5.3 Reaction Solution 1a (R1a)
Store at 2-10°C.Reaction Reagent 1b (R1b)
Store unused Reaction Reagent 1b (R1b) at 2-10°C.Mixed Reaction Reagent 1 (R1a+R1b)
After preparation, store at 2–10°C and use within 3 weeks.Reaction Reagent 2 (R2)
After preparation, store at 2–10°C and use within 3 weeks.The above are general guidelines; actual stability may vary depending on storage conditions. For example, if reagents are left in an automated analyzer after measurement, their usable period may be shortened depending on the analyzer’s operating status. When not in use, remove the reagents from the analyzer, cap them securely, and store as directed.
- Is control serum available?
- Yes, we provide control serum (Product No. 128-07131) for use in quality control.
- What is the amount of purified water to be added to the standard product?
Preparation of GLDH Standard Solution (60.0 U/L)
(A video demonstrating the adjustment procedure is available. Please refer to it as well.)
(1) Bring the reagent and purified water to room temperature (20°C-25°C) .
※ If lyophilized powder adheres to the upper part of the container, perform a centrifugation (spin-down) before use.(2) Add the specified amount of purified water* to the (A) GLDH standard according to the lot, and incubate at room temperature (20°C-25°C) for about 15 minutes.
※ Perform this step at room temperature (20°C-25°C) . Do not perform on ice or in low-temperature environments.
※ Add purified water by letting it run down the inner wall of the container.
※ Be careful not to let the pipette tip directly touch the lyophilized powder or the pre-dissolved GLDH standard solution. Residual enzyme in the tip may reduce activity values.(3) After incubation, gently pipette or invert the container to fully dissolve the contents without creating bubbles, and visually confirm complete dissolution.
※ Perform this step at room temperature (20°C-25°C) . Do not perform on ice or in low-temperature environments.
※ Avoid vigorous stirring as it may cause insoluble particles and decrease enzyme activity.
* The amount of purified water to add varies by lot. Please be sure to check the “Reconstitution of standard” section on our product webpage.Storage of GLDH Standard Solution (60.0 U/L)
-
The prepared GLDH standard solution (60.0 U/L) can be aliquoted into microtubes and stored frozen at -35°C or below.
※ Before use (before measurement) , aliquot the solution. Do not store aliquots that have been used for measurement.
※ Use frozen aliquots within 45 days.
※ Dissolved GLDH standard solution (60.0 U/L) that is not frozen must be used on the same day. - Please thaw the frozen GLDH standard solution (60.0 U/L) by allowing it to stand at room temperature (20°C-25°C) . After thawing, gently mix by pipetting or inversion, avoiding foaming.
※ Perform this step at room temperature (20°C-25°C) . Do not perform on ice or in low-temperature environments.
※ Avoid vigorous stirring as it may cause insoluble particles and decrease enzyme activity. - Do not refreeze once thawed GLDH standard solution (60.0 U/L)
-
The prepared GLDH standard solution (60.0 U/L) can be aliquoted into microtubes and stored frozen at -35°C or below.
Overview / Applications
Property
Manufacturer Information
Alias
For research use or further manufacturing use only. Not for use in diagnostic procedures.
Product content may differ from the actual image due to minor specification changes etc.
If the revision of product standards and packaging standards has been made, there is a case where the actual product specifications and images are different.