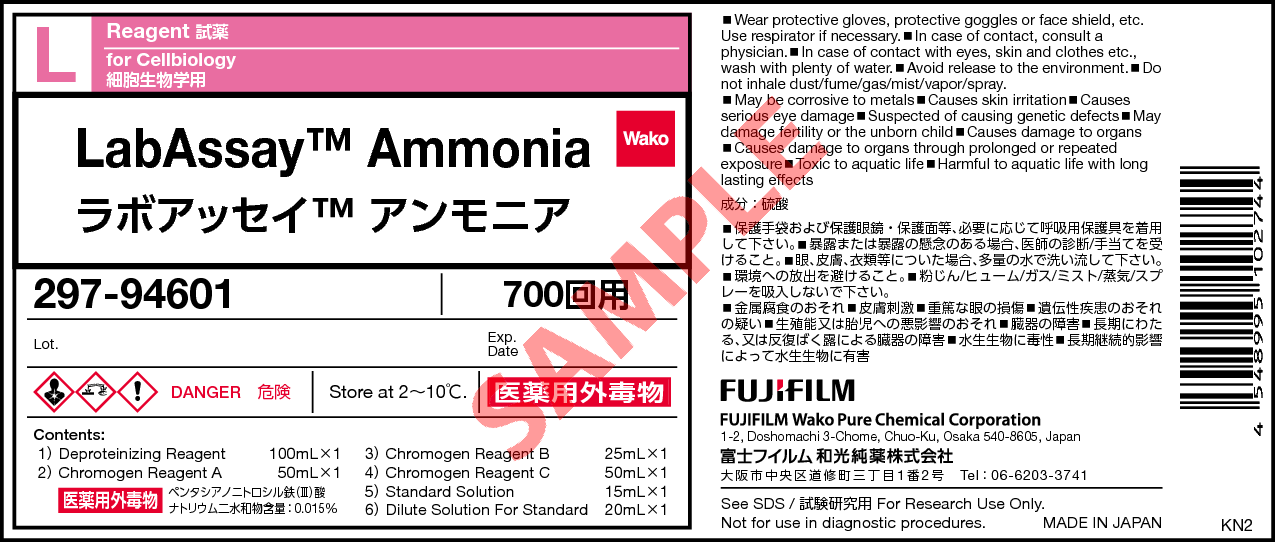
LabAssay (TM) Ammonia
- for Cellbiology
- Manufacturer :
- FUJIFILM Wako Pure Chemical Corporation
- Storage Condition :
- Keep at 2-10 degrees C.
- GHS :
-
- Structural Formula
- Label
- Packing
- SDS
|
Comparison
|
Product Number
|
Package Size
|
Price
|
Availability
|
Certificate of Analysis
|
Purchase |
|---|---|---|---|---|---|---|
|
|
|
700Tests
|
|
In stock in Japan |
※Check availability in the US with the distributor.
Document
Kit component
Kit component
| Deproteinizing Reagent | 100 mL / 1 bottle |
|---|---|
| Chromogen Reagent A | 50 mL / 1 bottle |
| Chromogen Reagent B | 25 mL / 1 bottle |
| Chromogen Reagent C | 50 mL / 1 bottle |
| Standard Solution (NH3-N 400 ug/dL) | 15 mL / 1 bottle |
| Dilute Solution for Standard | 20 mL / 1 bottle |
Overview
※For research purposes only with animal serum/plasma, Not for Diagnostic Use.
Introduction
Ammonia is converted to urea in the urea cycle and excreted.
LabAssay™ Ammonia is the reagent kit for assay of ammonia based on a colorimetric method using the Berthelot reaction. This kit is used for the quantitative determination of ammonia in mouse and rat blood. It is a simultaneous multi-sample assay format using a microplate, but measurements can also be made using a test tube.
Assay principle
The Deproteinizing Reagent deactivates the enzymes and removes the components that inhibit color reaction in a sample. After adding Deproteinizing Reagent to a sample and centrifuging, add Phenol, Sodium Pentacyanonitrosylferrate(III) Dihydrate, and Sodium Hypochlorite to the supernatant. The indophenol blue pigment is obtained by the following schematic reaction. The amount of ammonia contained in the sample is determined by measuring the absorbance of the blue color.
Performance
| Sample | blood, Serum, Plasma, Culture supernatant |
|---|---|
| Target animals | Mouse, Rat, Cat, Dog |
| Standard curve range | 100 - 400 μg / dL (μg / 100 mL) |
| Measurement time | Approx. 70 min. |
| Amount of sample | 70 μL |
| Measurement wavelength | 630 nm |
Standard Curve
Procedure
Assay in a microplate format
Perform the assay in the wells according to the following table scheme.
| Test | Standard | Blank | |
| An experiment can be conducted in a microtube | |||
| Deproteinizing Reagent |
Deproteinizing reagent:Sample = 4:1(v/v) | Deproteinizing reagent:Standard solution = 4:1(v/v) | 70 μL |
| Sample | - | ||
| Mix well. Centrifuge 5000×g, 4℃, for 15 min. Subsequent operations should be performed in the wells. |
Mix well. Subsequent operations should be performed in the wells. |
||
| Supernatant 70 μL | Mixed solution 70 μL | - | |
| Chromogen Reagent A |
70 μL | 70 μL | 70 μL |
| Chromogen Reagent B |
35 μL | 35 μL | 35 μL |
| Chromogen Reagent C |
70 μL | 70 μL | 70 μL |
| After adding each reagent to a microplate, mix well and incubate at 37 ℃, for 20 min. Mix well, then let stand at room temperature* for 30 min. Mix well, then measure the absorbance of the test sample and standard solution at 630 nm with the blank as the control. |
|||
*Room temperature: 20℃ - 25℃
Data
Spike-and-Recovery Test
Spike and Recovery Test of Ammoinia, a known amount of standard is spiked into in mous and rat sample n=2.
- Mouse Sample
Spike(µg/dL) Measured(µg/dL) Recovery(µg/dL) Recovery(%) - 81.8 - - 56.9 142 60.2 106 114 205 123 108 171 247 165 96.8 - Rat Sample
Spike(µg/dL) Measured(µg/dL) Recovery(µg/dL) Recovery(%) - 77.3 - - 56.9 137 59.7 105 114 188 111 97.5 171 236 159 93.1
Examples of measurement
- Mouse blood BALB/cAJc1 8W ♂
(n=2)sample No. Measured(µg/dL) 1 118 2 124 3 95.6 4 116 5 95 mean 110 SD 13.6 - Rat blood Jc1:SD 8W ♂
(n=2)sample No. Measured(µg/dL) 1 99.3 2 91.6 3 90 4 93.1 5 97.7 mean 94.3 SD 4.01
- Canine plasma EDTA
No. Age(years) Measured(μg/dL) mean SD CV(%) 1 4 232 210 221 15 7.0 2 6 194 178 186 12 6.2 3 10 225 207 216 13 5.9 4 12 208 196 202 8.2 4.1 5 6 181 202 192 15 7.7 6 11 155 175 165 14 8.6 7 10 144 151 147 5 3.5 8 12 156 173 164 12 7.2 - Canine serum
No. Age(years) Measured(μg/dL) mean SD CV(%) 1 4 331 365 348 24 6.9 2 6 296 323 310 19 6.2 3 6 409 465 437 40 9.1 4 11 367 365 366 1.6 0.4 5 12 453 513 483 42 8.7 6 6 349 366 357 12 3.4 7 10 451 504 478 37 7.8 8 4 291 323 307 22 7.2
- Feline plasma EDTA
No. Age(years) Measured(μg/dL) mean SD CV(%) 1 0.5 191 204 197 9.4 4.8 2 1.0 109 109 109 0.14 0.13 3 3.0 113 119 116 4.1 3.5 4 0.5 138 156 147 13 8.6 5 3.0 133 137 135 2.9 2.2 6 3.0 103 114 108 7.6 7.0 7 0.5 129 137 133 5.8 4.4 8 1.0 170 169 170 0.84 0.50 - Feline serum
No. Age(years) Measured(μg/dL) mean SD CV(%) 1 3.0 381 366 374 11 2.8 2 3.0 370 378 374 5.7 1.5 3 6.0 381 342 361 28 7.8 4 4.0 357 329 343 20 5.8 5 6.0 249 245 247 2.9 1.2 6 6.0 315 299 307 11 3.7 7 1.0 403 388 395 10 2.6 8 1.0 198 193 196 4.2 2.1
Reference
Inokuma, K. et al. : Microb. Cell Fact., 17, 153 (2018). Widespread effect of N-acetyl-D-glucosamine assimilation on the metabolisms of amino acids, purines, and pyrimidines in Scheffersomyces stipitis
Overview / Applications
Property
Manufacturer Information
Alias
- LabAssay
633-51761 (Previous code)
LABNH3-M1 (Previous code)
295-78901 (Previous code)
For research use or further manufacturing use only. Not for use in diagnostic procedures.
Product content may differ from the actual image due to minor specification changes etc.
If the revision of product standards and packaging standards has been made, there is a case where the actual product specifications and images are different.


