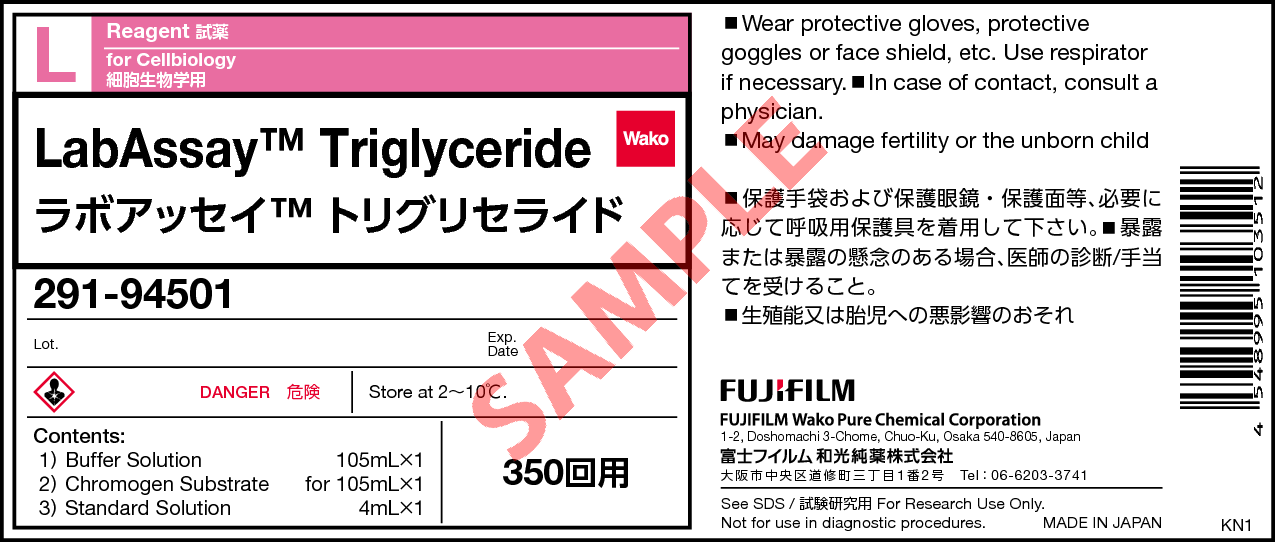
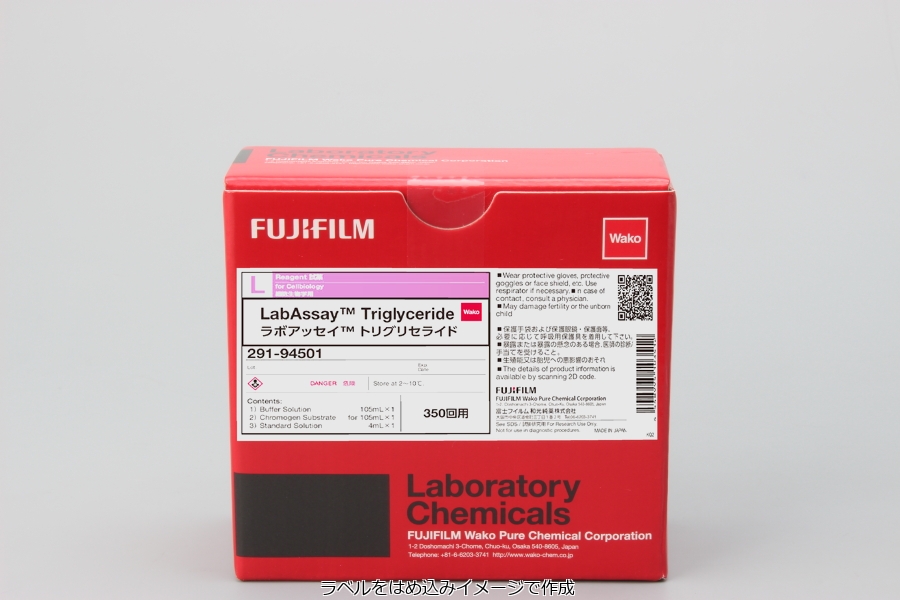
LabAssay (TM) Triglyceride
- for Cellbiology
- Manufacturer :
- FUJIFILM Wako Pure Chemical Corporation
- Storage Condition :
- Keep at 2-10 degrees C.
- GHS :
-
- Structural Formula
- Label
- Packing
- SDS
|
Comparison
|
Product Number
|
Package Size
|
Price
|
Availability
|
Certificate of Analysis
|
Purchase |
|---|---|---|---|---|---|---|
|
|
|
350Tests
|
|
In stock in Japan |
※Check availability in the US with the distributor.
Document
Kit component
Kit Contents
| Buffer Solution | 105 mL x 1 bottle |
|---|---|
| Chromogen Substrate | for 105 mL x 1 bottle |
| Standard Solution | 4 mL x 1 bottle |
Overview
※For research purposes only with animal serum/plasma, Not for Diagnostic Use.
Introduction
Triglycerides are neutral fats consisting of three fatty acids esterified to a glycerol backbone. There are triglycerides, cholesterol, phospholipids, free fatty acids and fat-soluble vitamins as lipid-soluble substances in the blood.
Assay principle
Triglycerides are converted to glycerol-3-phosphate by lipoprotein lipase and glycerolkinase. Hydrogen peroxide, which is produced by a reaction between the glycerol-3-phosphate and glycerol-3-phosphate oxidase(GPO), promotes oxidative condensation of N-ethyl-N-(2-hydroxy-3-sulfopropyl)-3,5-dimethoxyaniline sodium salt(DAOS) with 4-aminoantipyrine. LabAssay™ Triglyceride can be used to detect triglycerides concentration in samples by measuring absorbance of a blue color which is generated by the oxidative condensation reaction.
Procedure
Perform the assay in the wells according to the following table scheme.
| Test | Standard | Blank | |
|---|---|---|---|
| Chromogen reagent | 300 μL | 300 μL | 300 μL |
| Sample | Serum 2 μL | Standard solution 2 μL | - |
| Mix well and incubate at 37 ℃ for 5 min. Measure the absorbance at 600 nm*1 of the test sample and standard solution with the blank solution as the control. | |||
*1: In two wavelength assay, measure using Main wavelength 600 nm/Sub wavelength 700 nm.
Data
Performance
| Sample | Plasma, Serum, Urine |
|---|---|
| Target animals | Mouse, Rat, Cat, Dog |
| Standard curve range | 100 - 888 mg/dL (mg/100 mL) |
| Measurement time | Approx. 10 min. |
| Amount of sample | 2 μL |
| Measurement wavelength | 600 nm(Main), 700 nm(Sub) |
Standard Curve
Spike-and-Recovery Test
Spike and Recovery Test of Triglyceride, a known amount of standard is spiked into in mouse and rat sample n=2.
| Rat Sample | Spike(mg/dL) | Mean(mg/dL) | Recovery(mg/dL) | Recovery(%) |
|---|---|---|---|---|
| Serum | - | 130 | - | - |
| 131 | 257 | 127 | 97.0 | |
| 196 | 307 | 177 | 90.3 | |
| 262 | 370 | 240 | 91.6 | |
| 327 | 413 | 283 | 86.5 | |
| Plasma (EDTA) |
- | 128 | - | - |
| 135 | 256 | 128 | 94.8 | |
| 203 | 312 | 183 | 90.1 | |
| 271 | 374 | 245 | 90.4 | |
| 338 | 401 | 272 | 80.5 | |
| Plasma (Heparin) |
- | 123 | - | - |
| 134 | 257 | 134 | 100 | |
| 201 | 305 | 182 | 90.5 | |
| 268 | 365 | 242 | 90.3 | |
| 335 | 400 | 278 | 83.0 |
| Mouse Sample | Spike(mg/dL) | Mean(mg/dL) | Recovery(mg/dL) | Recovery(%) |
|---|---|---|---|---|
| Serum | - | 133 | - | - |
| 129 | 268 | 136 | 105 | |
| 194 | 342 | 209 | 108 | |
| 258 | 409 | 276 | 107 | |
| 323 | 448 | 315 | 97.5 | |
| Plasma (EDTA) |
- | 139 | - | - |
| 129 | 288 | 149 | 116 | |
| 193 | 342 | 203 | 105 | |
| 258 | 409 | 270 | 105 | |
| 322 | 446 | 307 | 95.3 | |
| Plasma (Heparin) |
- | 151 | - | - |
| 132 | 292 | 141 | 107 | |
| 198 | 349 | 198 | 100 | |
| 264 | 423 | 272 | 103 | |
| 329 | 442 | 291 | 88.4 |
Linearity-of-Dilution Test
Rat serum
-
Mouse serum
Example of measurement
-
Nomal Rat serum, Sprague Dawley, male No. Measured(mg/dL) mean SD CV(%) 1 54.5 53.1 53.8 1.0 1.9 2 153 153 153 0.41 0.27 3 105 95.8 100 6.4 6.3 4 120 125 123 4.1 3.4 5 102 107 104 3.7 3.5 -
Nomal Rat plasma K2EDTA, Sprague Dawley, male No. Measured(mg/dL) mean SD CV(%) 1 56.8 64.3 60.6 5.3 8.8 2 73.2 67.2 70.2 4.3 6.1 3 95.1 85.5 90.3 6.8 7.5 4 68.5 63.8 66.2 3.3 5.0 5 76.2 68.9 72.5 5.1 7.1
-
Nomal Mouse serum, CD-1(ICR), male No. Measured(mg/dL) mean SD CV(%) 1 80.8 77.9 79.3 2.0 2.6 2 78.4 76.7 77.6 1.2 1.6 3 81.3 75.6 78.4 4.1 5.2 4 57.4 60.3 58.8 2.0 3.5 5 48.7 53.3 51.0 3.3 6.4 -
Nomal Mouse plasma K2EDTA, CD-1(ICR), male No. Measured(mg/dL) mean SD CV(%) 1 28.8 31.7 30.2 2.0 6.7 2 132 145 139 9.5 6.9 3 62.7 68.0 65.4 3.8 5.8 4 29.5 25.8 27.6 2.6 9.5 5 58.8 55.1 56.9 2.7 4.7
-
Nomal Canine plasma EDTA,Beagle,male No. Measured(mg/dL) mean SD CV(%) Age(years) 1 37.2 33.9 35.5 2.3 6.5 4 2 29.0 27.6 28.3 1.0 3.6 6 3 32.5 36.0 34.2 2.5 7.4 10 4 33.5 36.4 34.9 2.1 5.9 12 5 33.2 30.3 31.8 2.1 6.6 6 6 24.9 22.9 23.9 1.4 6.0 11 7 31.9 28.4 30.2 2.5 8.2 10 8 63.2 57.0 60.1 4.36 7.3 12 -
Nomal Canine serum,Beagle,male No. Measured(mg/dL) mean SD CV(%) Age(years) 1 35.6 39.7 37.7 2.9 7.7 4 2 33.8 37.0 35.4 2.2 6.3 6 3 28.6 31.0 29.8 1.7 5.7 6 4 102 109 105 4.6 4.4 11 5 37.3 34.2 35.8 2.2 6.0 12 6 25.3 24.4 24.8 0.68 2.7 6 7 18.6 16.5 17.5 1.4 8.1 10 8 47.7 42.7 45.2 3.5 7.9 4
-
Nomal Feline plasma EDTA,Short hair,male No. Measured(mg/dL) mean SD CV(%) Age(years) 1 104 104 104 0.21 0.20 0.5 2 34.3 31.8 33.1 1.7 5.3 1.0 3 54.8 49.3 52.1 3.9 7.5 3.0 4 65.1 60.7 62.9 3.1 5.0 0.5 5 43.9 44.4 44.1 0.41 0.94 3.0 6 29.0 31.9 30.5 2.1 6.7 3.0 7 16.8 16.2 16.5 0.4 2.5 0.5 8 25.0 27.2 26.1 1.5 5.8 1.0 -
Nomal Feline serum,Short hair,male No. Measured(mg/dL) mean SD CV(%) Age(years) 1 32.4 35.9 34.1 2.5 7.3 3.0 2 18.4 20.2 19.3 1.3 6.7 3.0 3 33.9 36.6 35.3 1.9 5.4 6.0 4 48.9 53.8 51.3 3.5 6.8 4.0 5 33.9 32.8 33.4 0.82 2.5 6.0 6 45.3 47.1 46.2 1.24 2.7 6.0 7 96.6 88.0 92.3 6.1 6.6 1.0 8 52.3 54.7 53.5 1.7 3.1 1.0
References
- Gao, F. et al. : Evid. Based Complement. Alternat. Med., 2015, 801291 (2015). *Extraction liquid of rat liver
- Funakoshi, T. et al. : Biochem. Biophys. Rep., 13, 39 (2018). *Rat muscle satellite cell
- Moser, V. A. and Pike, C. J. : eNeuro, 4, e0077-17 (2017). *Rat plasma
- Fujii, N. et al. : Aging Cell, 16, 508 (2017). *Rat plasma
- Wang, F. et al. : J. Mol. Endocrinol., 52, 133 (2014). *Rat plasma
- Kato, H. et al. : J. Hepatol., 60, 1032 (2014). *Extraction liquid of mouse liver
- Fujimori, K. et al. : Prostaglandins. Other. lipid. Mediat., 94, 96 (2011). *Extraction liquid of mouse culture cells
Overview / Applications
Property
Manufacturer Information
Alias
- LabAssay
632-50991 (Previous code)
LABTRIG-M1 (Previous code)
290-63701 (Previous code)
For research use or further manufacturing use only. Not for use in diagnostic procedures.
Product content may differ from the actual image due to minor specification changes etc.
If the revision of product standards and packaging standards has been made, there is a case where the actual product specifications and images are different.


