qNMR Measurement
External Magnetic Field Strength
Sensitivity, resolution and peak separation in an NMR spectrum depend on the external magnetic field strength.
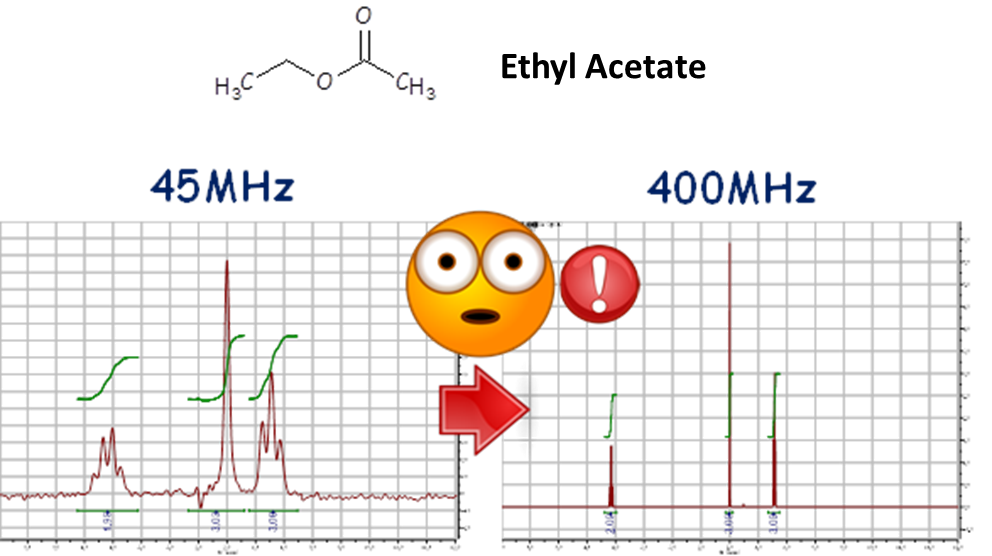
The comparison results of 1H NMR spectra of the same sample solution of ethyl acetate acquired by external magnetic field strengths of 45 MHz and 400 MHz1). From this comparison result, 400 MHz has much better sensitivity and resolution than 45 MHz, and you can see at a glance that the external magnetic field strength has a big impact on the sensitivity and resolution of NMR spectrum. In principle, the analytical value in the Japanese Pharmacopoeia is supposed to be reported by two significant digits, and the purity value by quantitative NMR (qNMR) of (E)-cinnamic acid stipulates the use of a nuclear magnetic resonance spectrometer with 1H resonance frequency of 400 MHz or higher, ensuring the reliability of the analytical value up to two significant digits with good sensitivity, resolution and peak separation for the spectrum acquired.
1) Shinya, T. Toru, M. et al.: The 1st annual meeting of qNMR-J, Poster session (2019).
Digital Resolution and Spectral Width
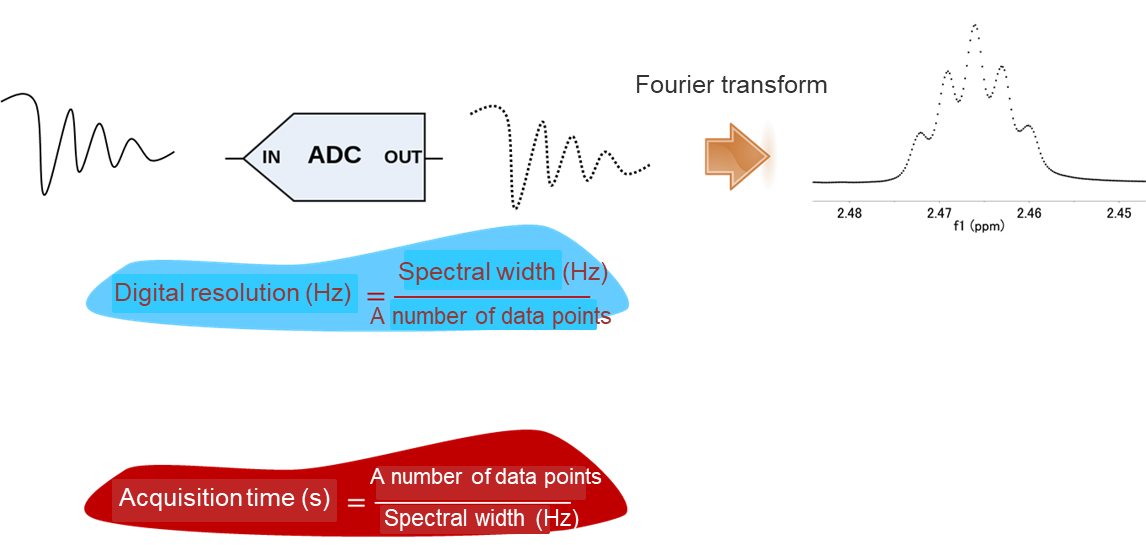
The NMR signal (Free Induction Decay or FID) is detected as an analog signal and digitized by the analogue-to-digital converter (AD converter). At this time, the number of data points of FID is reflected in the NMR spectrum after Fourier transform, and the interval between the points of the NMR spectrum is called the digital resolution (Hz). The purity value by quantitative NMR (qNMR) of (E)-cinnamic acid in the Japanese Pharmacopeia stipulate that the digital resolution should be set to 0.25 Hz or less. Digital resolution is generally set automatically from the number of data points and spectral width without setting it as a parameter. With a small number of data points, it is impossible to perform a faithful reproduction of the original analogue data. For qNMR measurements, it is desirable to acquire NMR data with a number of data points that can achieve sufficient digital resolution. However, if the number of data points is too large, the reciprocal of that, the acquisition time, will be long, and this will acquire unnecessary noise, decreasing the SN ratio. So we should take care of this point as well.
Flip Angle and Repetition Time
The flip angle is tilt angle of the bulk nuclear magnetization vector, relative to the static magnetic field after applying a radio frequency (RF) pulse of specific duration and amplitude in a static magnetic field at thermal equilibrium. The repetition time is time period from the application of the first RF pulse of a pulse sequence until the same pulse is applied again in the subsequent scan. Even if it is explained, it is a little complicated, so first of all we will discuss the detection principle of the NMR signal from the vector model.
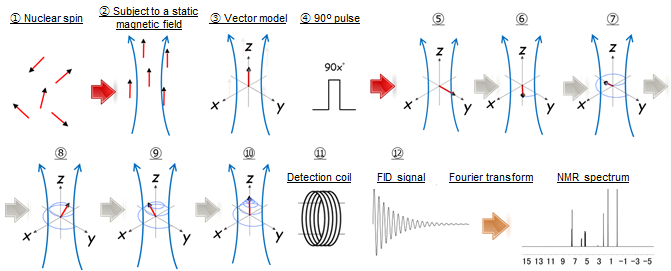
(1) The atomic nucleus has a positive charge and a magnetic property by rotation (called nuclear spin).
(2) Normally, innumerable nuclear spins are oriented in random directions, but when subjected to a static magnetic field, they are split into the two directions; the direction of static magnetic field and the opposite direction. At this time, there are slightly more nuclear spins that orient the direction of the static magnetic field. So, as the behavior of the entire nuclear spin, we can consider the vector in the direction of the static magnetic field (called the magnetization vector).
(3) Here, in order to discuss the NMR phenomenon, a vector model (a method of using the rotating coordinate system and the movement of magnetization vector) is used.
(4) When an RF pulse is applied from the x-axis direction, the magnetization vector rotates (tilts) clockwise in the y-z plane.
(5) - (10) The magnetization vector tilted in the y-z plane returns to the z-axis direction while rotating at the resonance frequency (called relaxation). If the above relaxation process is limited to the y-axis direction, you can see that its signal intensity is getting smaller while decaying.
(11) - (12) The NMR signal (FID) is the signal that detected the y-axis component of this magnetization vector by the detection coil.
Here, when focusing on the pulse angle, as can be seen from the vector model, the y-axis component (signal intensity) of the magnetization vector is maximized when a 90° pulse is irradiated; the sensitivity become highest. Furthermore, as can be seen from the table below showing the relationship between the repetition time (Tr), the spin-lattice relaxation time (T1), and the magnetization recovery rate (%), assuming that the magnetization is recovered by 99.9% or more, it can be seen that the 90° pulse is more advantageous than the 30° pulse in terms of the sensitivity (SN ratio) obtained by scanning within a certain period of time. Here, the spin-lattice relaxation time (T1) is time constant, required for a nuclear spin to obtain an equilibrium state in a magnetic field.
| Tr / T1 | Pulse angle | |
|---|---|---|
| 90° | 30° | |
| 1 | 63.2 | 92.8 |
| 4 | 98.2 | 99.8 |
| 7 | 99.9 | 100.0 |
| 10 | 100.0 | 100.0 |
Tr: Repetition time (s)
T1: Relaxation time (s)
In addition, when focusing on the repetition time, as can be seen from the vector model, if the next pulse is irradiated before the magnetization recovery, the y-axis component (signal intensity) is saturated. At this time, if the T1 value differs between the signals, the intensity will be biased between the signals, and as a result, an accurate quantitation cannot be performed in the qNMR measurement. Although it depends on the type of deuterated solvent used and the external magnetic field strength of the NMR instrument, T1 of a general organic compound is not more than about 8 seconds, so setting the repetition time to 60 seconds will satisfy the 99.9% or more magnetization recovery rate of all signals, and it will show no bias in the intensity between the signals. For qNMR measurement, it is recommended to set 90 ° flip angle and 60 seconds repetition time as default settings, and optimize these parameters according to the analysis time, intended purpose of analysis and target accuracy.
Number of Transients (Number of Scans)
The number of transients is number of times that NMR data acquisition is repeated with the resulting FIDs accumulated to improve the signal sensitivity of the NMR spectrum. It is known that the sensitivity obtained by NMR measurement is proportional to the positive square root of the number of integrations. In general, the number of transients is set in consideration of the sensitivity (SN ratio) of the NMR spectrum actually obtained. In addition to the number of transients, the sensitivity obtained by NMR measurement depends on the sample solution concentration and the external magnetic field strength of the NMR instrument. Therefore, these three components should be taken in consideration set the conditions while checking the SN ratio. In the purity value by quantitative NMR (qNMR) stipulated in the Reagents / Test Solutions section of the Japanese Pharmacopoeia, the test conditions (external magnetic field strength of NMR instrument, sample solution concentration and number of transients) have been set so that the SN ratio of the signal used for quantification is 100 or more in order to ensure the accuracy with two significant digits.
Resolution
The external magnetic field of an NMR instrument generally has non-uniformity, but this non-uniformity is corrected by shim coils arranged around the detection unit generate an additional magnetic field driven by an electric current. This procedure is called shim adjustment. If the external magnetic field is non-uniform, the NMR spectrum will have bad spectral shape, resulting in difficulty in obtaining accurate signal area. From the above, shim adjustment is an extremely important procedure, especially in qNMR measurement, which requires accurate evaluation of signal areas.
Other than the above, the main factors that degrade the resolution of the NMR spectrum are exemplified below.
- Insufficient dissolution of sample or calibration standard in solvent
- Causes derived from the compound structure itself
- Poor dimensional accuracy of NMR tubes (poor roundness, distortion, etc.)
As described above, in qNMR measurement where the accuracy of the signal area is critical, it is recommended to use an NMR tube with high-dimensional accuracy that can obtain good peak shape and resolution.
Here, we would like to introduce the product line of NMR tubes suitable for qNMR measurement. Our NMR tubes have high dimensional accuracy that conforms to the Japanese national industrial standard, JIS K 0138 Quantitative Nuclear Magnetic Resonance Spectroscopy General Rules (qNMR General Rules). These products are made of borosilicate glass with high roundness and low distortion so that the sensitivity and resolution are good, and the cap is made of materials with little elution such as plasticizers.
The Cautionary Points in qNMR Data Processing
Zero filling
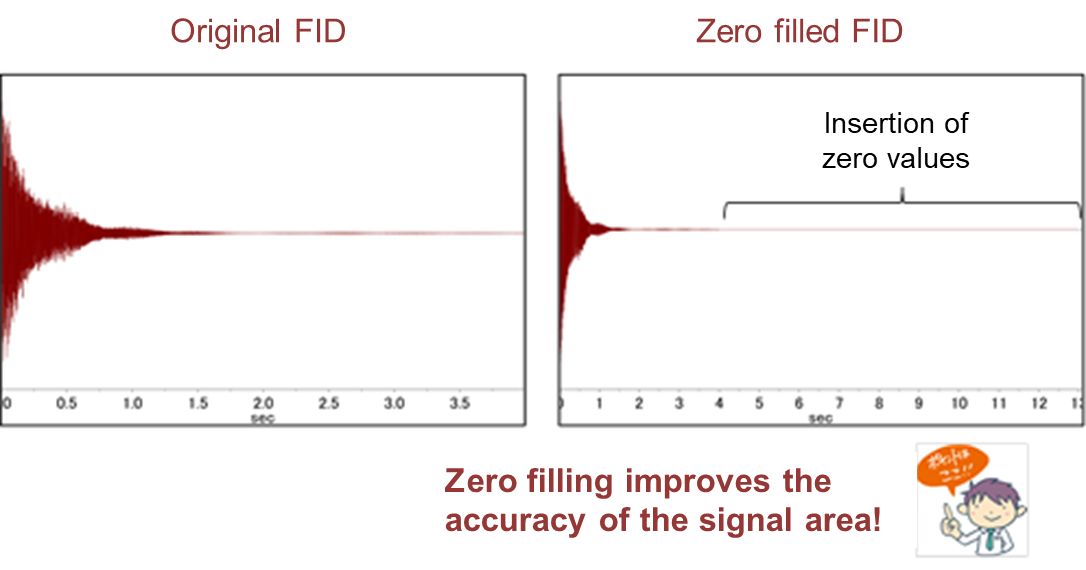
Zero filling is insertion of zero values at the end of a FID signal prior to Fourier transformation, a means to increase the frequency domain resolution of an NMR spectrum. Zero filling is recommended for qNMR measurements where the accuracy of the signal area is critical.
Phase correction
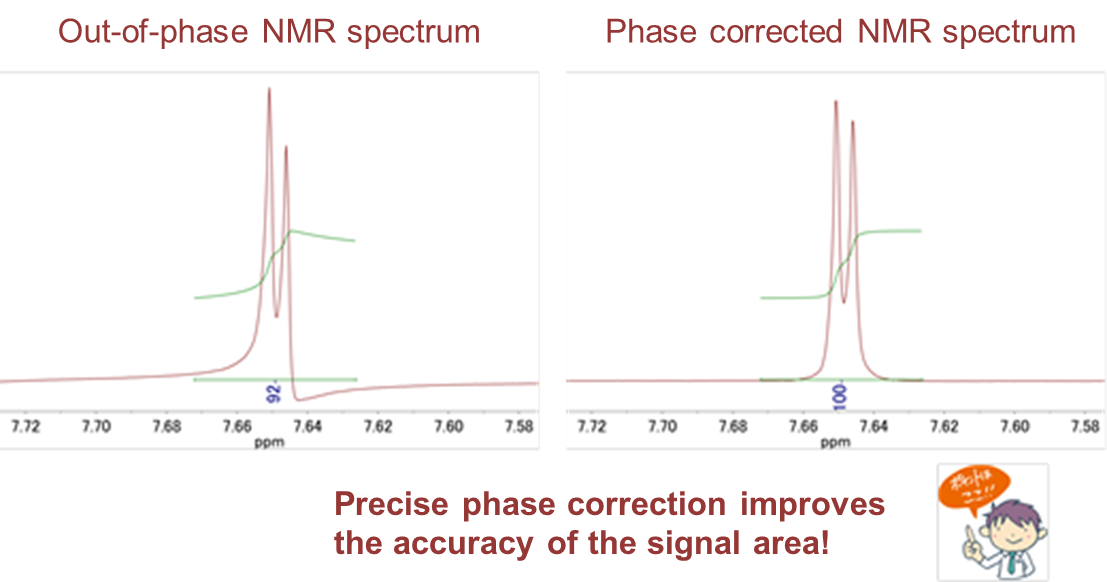
In NMR measurement, it is necessary to restore a pure absorption line shape over the whole NMR spectrum after acquiring the NMR signal since the phase of the NMR signal is not recognized prior to data acquisition, and this data processing is called phase correction. Recent advances in data processing software have made it possible to perform phase correction automatically and accurately, but it may be incomplete. In the out-of-phase NMR spectrum, the signal area may not be evaluated accurately. In qNMR measurement, it is necessary to carefully and manually correct the phase so that the signals of the target sample and calibration standard for qNMR have a pure absorption line shape since an out-of-phase NMR spectrum causes bias and variability of the signal area.
Baseline correction
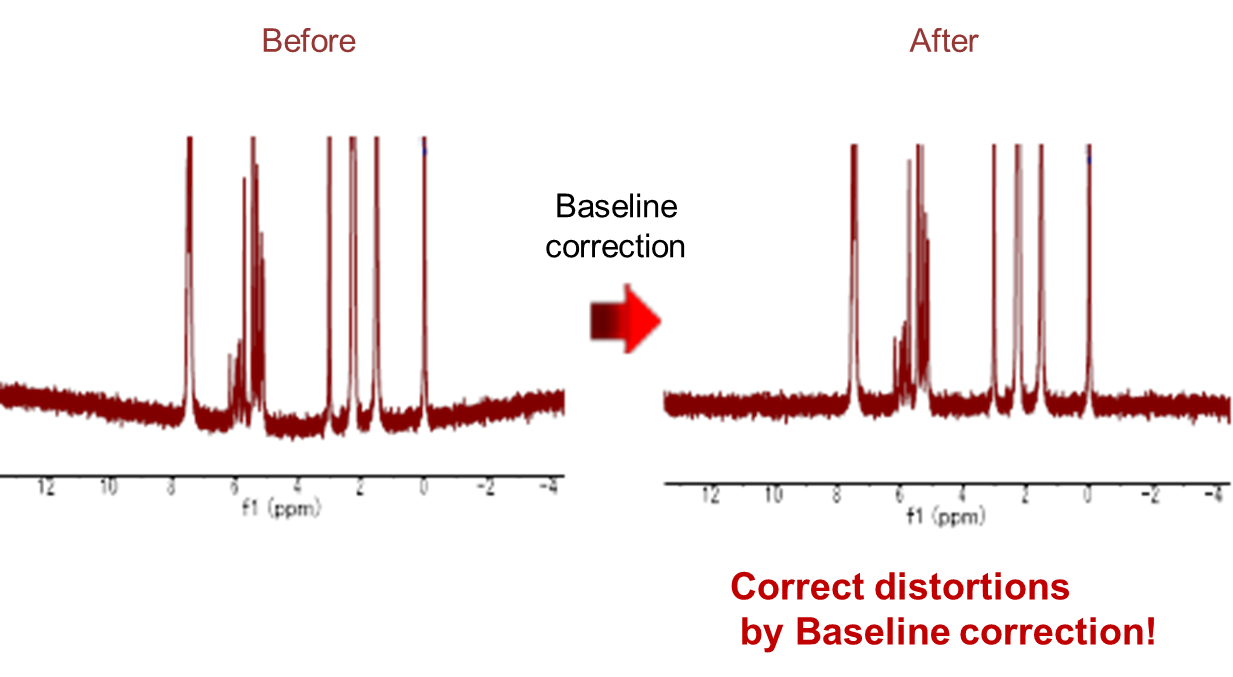
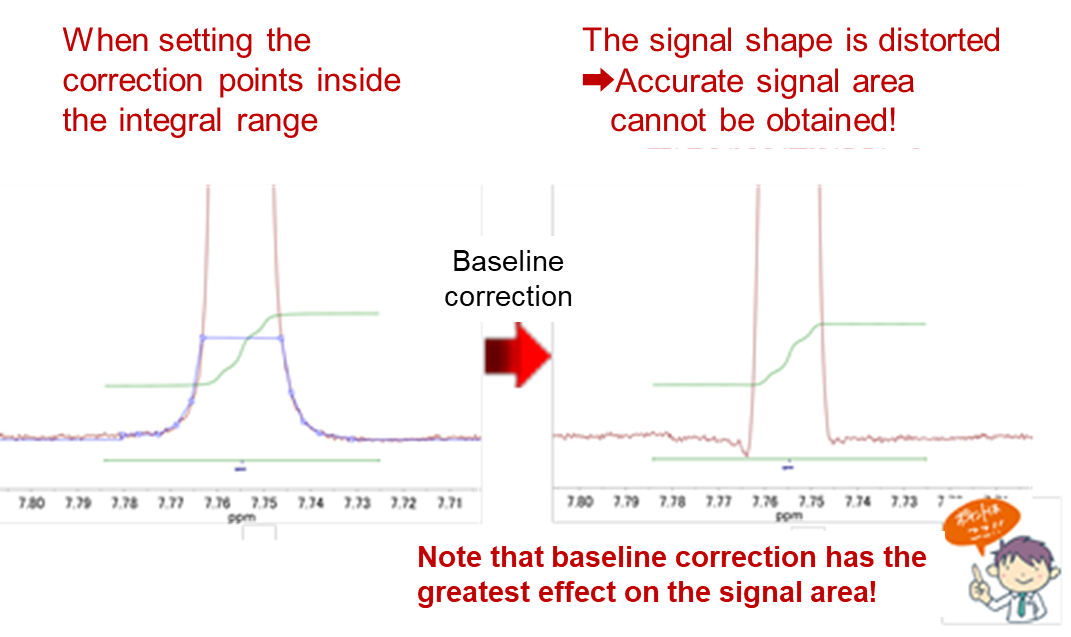
NMR instruments utilize filters in order to exclude signals outside of the chemical shift region of interest and so NMR spectra generally have a distortion due to the influence of the sensitivity property of the filter. The mathematical procedure used to correct distortions in the baseline of an NMR spectrum is called baseline correction. In recent data processing software, multiple algorithms are prepared for this processing, but for qNMR measurement, it is common to correct distortions by adding multiple points that can be regarded as baseline. In this processing, if there is a correction point at the inside of the signal, the signal shape will be distorted, so it is desirable to set the correction point outside the signal (e.g., outside of the integral range) so that distortion does not occur.
Integral range
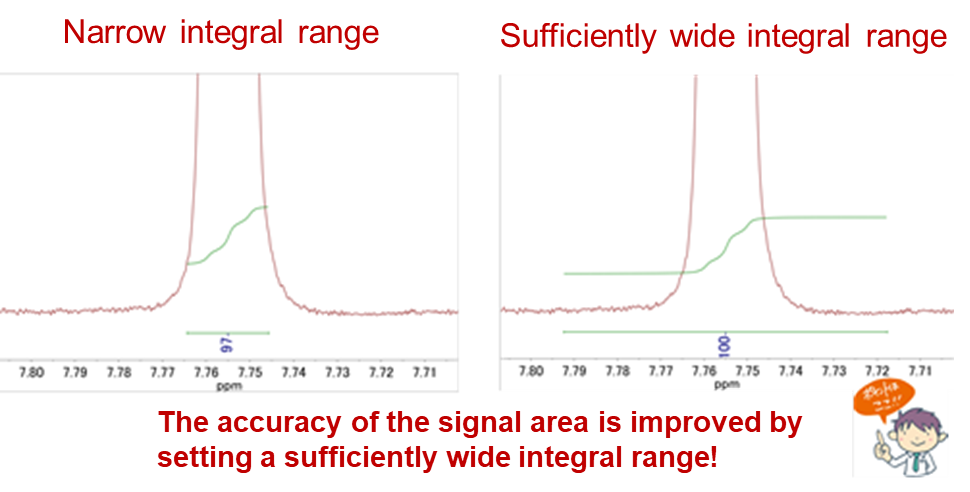
NMR signals are generally Lorentzian shape, with a large spread of the lowest part of signal, and accurate signal area cannot be obtained unless the appropriate start and end points for the integral range are set. The Lorentzian signal theoretically encompasses of 98% of a pure signal area by setting an integral range of ±10 times the half width of the signal, and ±30 times encompasses about 98% of it. In NMR unlike chromatography, each signal observed in the NMR spectrum is rarely a singlet signal, and from the above, it is difficult to determine the integral range simply based on the half width. For the scientifically valid setting of the integral range in qNMR measurement, you can set it by a method that the integral range is expanded to the left and right side at equal intervals based on a certain point and then the points where the signal area becomes equilibrated can be set as the integral range1).
- Yamazaki, T., Saito, T., Miura, T. and Ihara, T. : BUNSEKI KAGAKU, 61, 963 (2012).
For research use or further manufacturing use only. Not for use in diagnostic procedures.
Product content may differ from the actual image due to minor specification changes etc.
If the revision of product standards and packaging standards has been made, there is a case where the actual product specifications and images are different.


