[Technical Report] Simultaneous Analysis of Veterinary Drugs Using STQ Method
This article was written by Ms. Mikie Shima, AiSTI SCIENCE Co., Ltd., Technical & Marketing Group, for Vol. 13 (August 2020), of ChemGrowing.
The content of this article is from the time of publication. It is not the latest information due to new knowledge and changes in regulatory rules after original publication.
Introduction
As interest in food security and safety is increasing, the analysis of veterinary drugs remaining in food is important. However, there are various kinds of veterinary drugs with different physical properties, and it is not easy to analyze them simultaneously. In addition to analytical precision, "speed" and "simplicity" are also required. In this application, we introduce the results obtained by applying the STQ (Solid phase extraction Technique with QuEChERS method) method, which is a "rapid, simple, and highly purified" method for analysis of residual pesticides, to the analysis of veterinary drugs.
Outline of STQ Method
The outline of STQ method is shown in Figure 1.
In the STQ method, extraction of a sample homogenized by the pre-freezing and cryogenic milling with dry ice method is performed referring to the QuEChERS method, and the sample is purified using a solid phase column Smart-SPE with a small filling amount of several tens of mg.
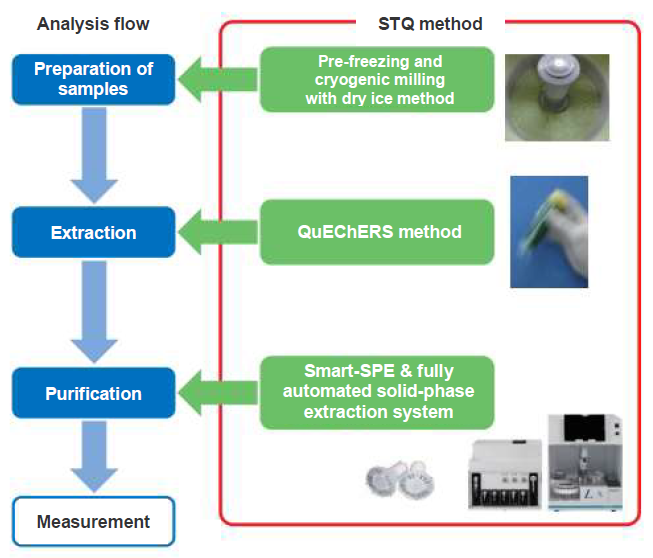
Figure 1. Outline of STQ Method
In the pre-freezing and cryogenic milling with dry ice method, homogenization is assured even with a sample collected in a small amount because the samples can be ground to a fine powder by the method. Then, downscaling the analytical system is attempted by combining extraction by the QuEChERS method with solid-phase column Smart-SPE. Thus the analysis can be done more rapidly, with improved operability and lower cost.
In the purification process of the STQ method, a high purification effect is achieved by using a "solid-phase column." Because the extract is prepared by the QuEChERS method, which is "partitioning-only," purification is insufficient and pesticides are also adsorbed. On the other hand, the solid-phase column extraction technique adopted in the STQ method enables efficient recovery of pesticides while adsorbing impurities in the "partition/separation action" level. The operability of a solid phase column is simplified and streamlined by using the dedicated fully automated solid-phase extractor system ST-L400 and pretreatment kit. As the purification affects the reliability of the qualitative and quantitative analysis of peaks and the frequency of maintenance of the measuring device, improvement of the purification is one of the most important factors in pretreatment.
As described above, the STQ method is a "rapid, simple, and highly purified" method that takes into account the total balance from homogenization of samples to analysis.
Analytical Method
Analytical Samples
In this application, chicken tender, pork medallion and beef fillet were used as meat (muscle), chicken egg and milk were used as other stock farm and aquatic products, and frozen deep-fried chicken as an example of processed meat products. All of them were commercial products.
Standard Solutions
The following mixture standard solutions manufactured by FUJIFILM Wako were used.
- Veterinary drug mixture standard solutions (quinolones) (Code No. 227-02051)
- Veterinary drug mixture standard solutions (sulfa drugs + antifolates) (Code No. 228-02081)
- Veterinary drug mixture standard solutions (macrolides) (Code No. 225-02091)
- Veterinary drug mixture standard solutions (hormones) (Code No. 220-02203)
Preparation of Samples
Homogenization of samples is important for maintaining analytical precision. The same is true for meat samples, but in the case of room temperature milling, fibers may remain intact or the samples may become lumpy and not be uniformly milled. Using the pre-freezing and cryogenic milling with dry ice method, the samples are pre-frozen with dry ice and then ground with dry ice in the frozen state to be homogenized into a powder (Figure 2). In the present recovery test, chicken tender, pork medallion, beef fillet and frozen deep-fried chicken were ground by the pre-freezing and cryogenic milling with dry ice method using a Large Volume Freeze Crusher (Code No. 387-17711) (Figure 3).
Whole chicken eggs were agitated in the food processor to homogenize.
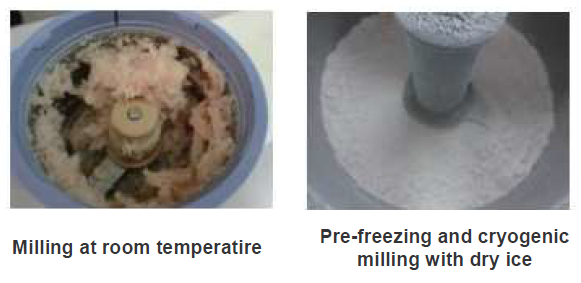
Figure 2. Comparison between Milling at Room Temperature and Pre-freezing and Cryogenic Milling with Dry Ice (Chicken Tender)
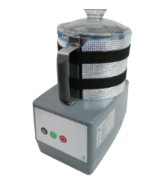
Figure 3. Large Volume Freeze Crusher
Extraction
Quinolones used in the recovery test are compounds that have a basic skeleton of 4-quinolone and contain a carboxyl group (-COOH) in their structure. This highly polarized group becomes dissociated under neutral conditions and exhibits low polarity in acidic condition (Figure 4).
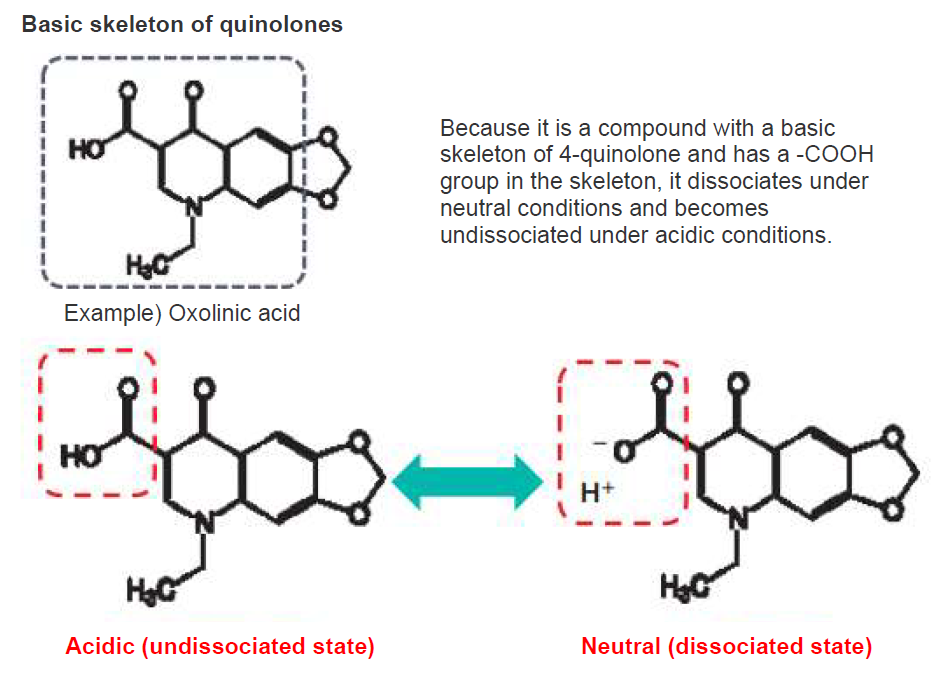
Figure 4. Quinolones
First, components other than quinolones are extracted using acetonitrile (neutral) and transferred to the acetonitrile layer. Since quinolones are dissociated at this time, they move to the aqueous layer. Then, acidic acetonitrile containing formic acid is added to the residue, and undissociated quinolones are extracted and transferred to the acetonitrile layer containing formic acid Then both extracts are combined and made to a constant volume. As described above, it is possible to transfer the quinolones, which are contained in the aqueous layer in the neutral condition, to the solvent layer by the "constant volume method with repetitive extraction" using neutral acetonitrile and acidic acetonitrile made with formic acid, and combining this with other components by a constant volume operation to ensure precision quantitatively (Figure 5).
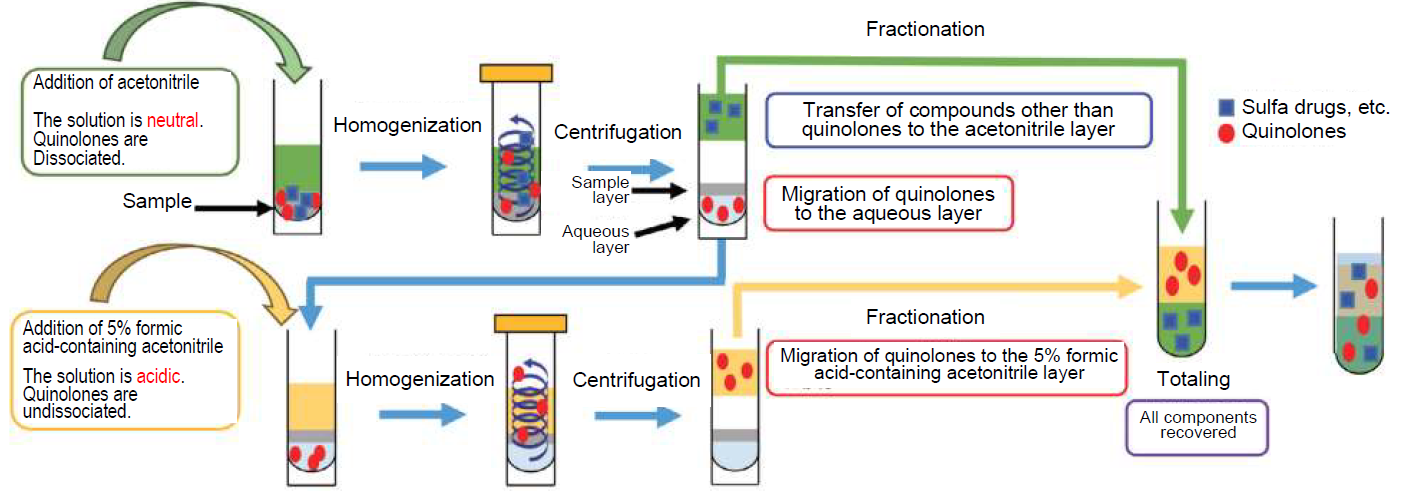
Figure 5. Constant Volume Method with Repetitive Extractions
After weighing 5 g of each sample, the standard solution in 3-2 was added to make the concentration of each sample 0.01 ppm. Then, water was added to make the water content in the samples 5 g for chicken tender, pork medallion, beef fillet and frozen deep-fried chicken in which the water content is less than 80%. After addition of 10 mL of acetonitrile, the samples were homogenized for 1 minute. 0.5 g of sodium chloride and 2 g of anhydrous magnesium sulfate were added, and the mixture was shaken vigorously by hand for 1 minute. After centrifugation, the acetonitrile layer ([1]) was transferred to a graduated test tube. 10 mL of acetonitrile containing 5% formic acid was added to extract quinolones. Homogenization was performed for 1 minute, followed by vigorous shaking by hand for 1 minute. After centrifugation, 5% formic acid-containing acetonitrile layer ([2]) was transferred to the graduated test tube and combined with [1]. The volume was made 20 mL with acetonitrile and the solution was used as the extract (Figure 6).
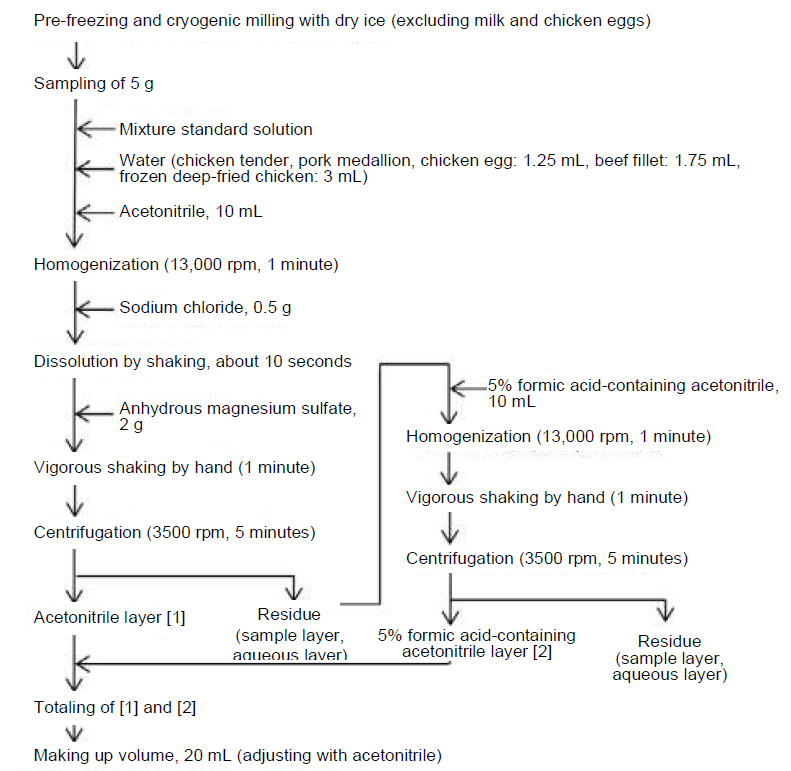
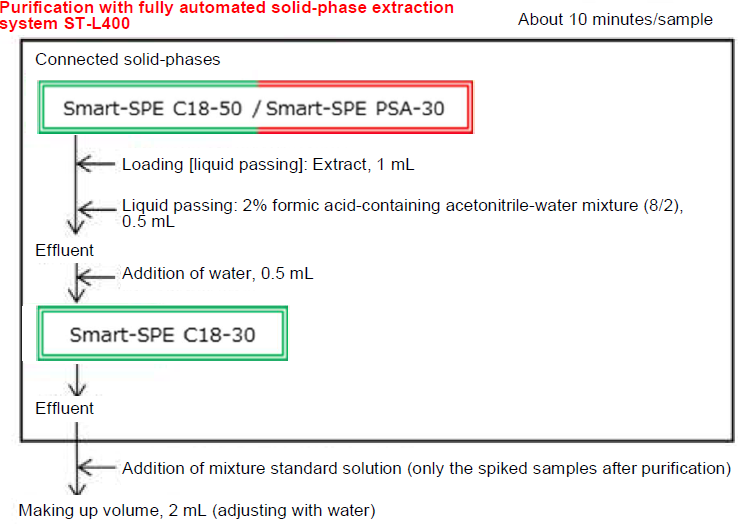
Figure 6. Pretreatment Flow
Purification
Purification was performed by the fully automated solid phase extraction system ST-L400 (Figure 7) using a total of 3 solid-phase columns comprising of Smart-SPE C18-50 (Code No. 304-94981), C18-30 (Code No. 307-94971) and PSA-30 (Code No. 301-94991).
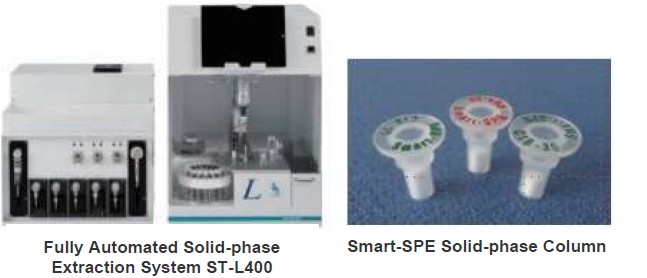
Figure 7. Fully Automated Solid-phase Extraction System ST-L400 and Smart-SPE Solid-phase Column
In the fully automated solid-phase extraction system ST-L400, each solid-phase column is connected as shown in Figure 8 and the solution is passed through the columns. C18 is a non-polar solid phase column and retains non-polar and low-polar components in the sample. PSA retains acidic and ionic substances. In Figure 8, [1] C18-50 retains non- and low-polar impurities after loading the sample allowing passage of target components.
In [2] PSA-30 connected beneath C18-50, acidic substances such as fatty acids and ionic impurities are retained and pass through the target components. Since quinolones are retained in addition to these impurities, an acidic solution is passed through after loading the sample to elute undissociated quinolones from PSA. To the effluents from these two types of connected solid-phase columns, water is added from the nozzle connected beneath the solid-phase column [1] and [2] to lower the ratio of acetonitrile, and the solution is passed through [3] C18-30. Water is added to the effluent to reduce the ratio of acetonitrile and low-polar impurities that were not eliminated with [1] C18-50 are eliminated with [3] C18-30. Above operations can reduce the burden of impurities to the analytical columns (ODS).
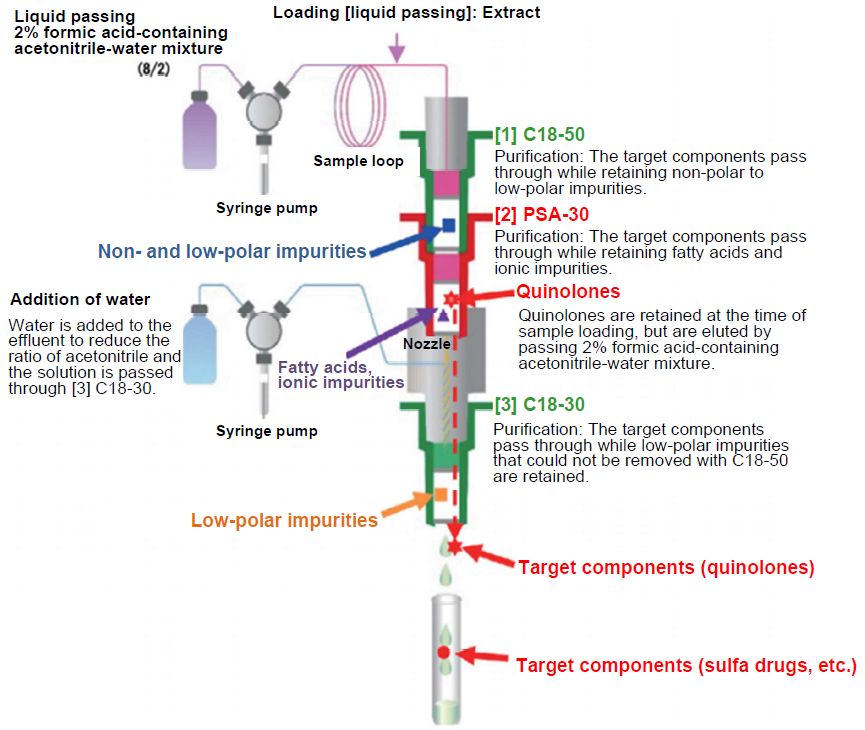
Figure 8. Purification Process with Fully Automated Solid-phase Extraction System ST-L400
1 mL of the extract obtained in 3-4. was loaded to the port of C18-50 (50 mg) and PSA-30 (30 mg), and 0.5 mL of 2% formic acid-containing acetonitrile-water mixture (8/2) was passed through the column. The effluents from C18-50 and PSA-30 were passed through C18-30 (30 mg) while adding 0.5 mL of water. The effluents were all received in a test tube and the volume was increased to 2 mL (Figure 6).
In order to confirm the influence of ionization inhibition at the time of measurement, the sample (without the addition of the standard solution) was pretreated in the same manner as the above, purified and added standard solution to make the concentration 0.01 ppm in the sample.
Measuring Conditions
The samples obtained were measured by LC-MS/MS. The measurement conditions are shown in Table 1.
Table 1. Measuring Conditions
| Instrument | |
|---|---|
| LC | : Nexera X2 (SHIMADZU Co.) |
| LC-MS | : LCMS-8045 (SHIMADZU Co.) |
| LC conditions | |
| Column | : YMC-Triart C18 (150 x 2.1 mm I.D., S-3 μm, 12 nm) |
| Eluent | : Mobile phase A: 0.1% formic acid in water B: 0.1% formic acid in acetonitrile |
| Flow rate | : 0.2 mL/min |
| Gradient | : B Conc. 1% (0 min)→15% (1 min)→40% (6 min)→100% (10-15 min)→1% (15.01-18 min |
| Injection vol. | : 5 μL (with water 10 μL) |
| Column temperature | : 40℃ |
| MS conditions | |
| Ionization | : ESI positive and negative |
| Mode | : MRM |
Results
The results of the recovery test of the 46 components in the mixture standard solutions are shown in Table 2, and representative chromatograms are shown in Figure 9. The recovery rate was calculated by comparing the peak area of each component in the recovery test sample with that from the standard solution at the same concentration. The concentration of the recovery test samples in the vial was 1.25 ppb. In addition, the following 2 types of recovery rates were calculated to confirm the influence of ionization inhibition during measurement.
A: Recovery rate (%) with the use of solvent std
Solvent std
Mixture standard solution prepared by diluting the standard solution in 3-2. to 1.25 ppb with the solvent (the diluent is a mixture of acetonitrile, 5% formic acid-containing acetonitrile, water, and 2% formic acid-containing acetonitrile-water (8/2) in 1:1:1:1)
Calculation formula
Area from the recovery sample / area from 1.25 ppb of the solvent std x 100
B: Recovery rate (%) with the use of matrix std
Matrix std
The solution with the addition of standard after purification in 3-5. (concentration in the vial is 1.25 ppb)
Calculation formula
Area from the recovery sample / area from 1.25 ppb of the matrix std x 100
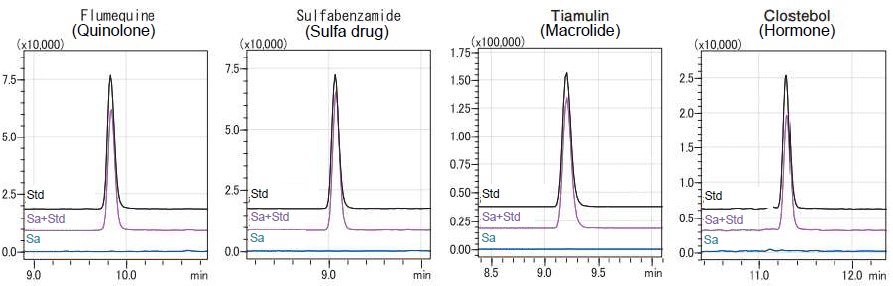
Figure 9. Representative Chromatograms
Table 2. Recovery Test Results
Spiked concentration: 0.01 ppm in the sample (n=3)
| No. | Compound name | Classi fication1) |
Ionization mode2) |
Retention time3) (minutes) |
Chicken tender | Pork medallion | Meef fillet | Milk | Egg | Deep-fried chicken | ||||||
|---|---|---|---|---|---|---|---|---|---|---|---|---|---|---|---|---|
| When solvent std is used4) |
When matrix std is used5) |
When solvent std is used4) |
When matrix std is used5) |
When solvent std is used4) |
When matrix std is used5) |
When solvent std is used4) |
When matrix std is used5) |
When solvent std is used4) |
When matrix std is used5) |
When solvent std is used4) |
When matrix std is used5) |
|||||
| Recovery (%) |
Recovery (%) |
Recovery (%) |
Recovery (%) |
Recovery (%) |
Recovery (%) |
Recovery (%) |
Recovery (%) |
Recovery (%) |
Recovery (%) |
Recovery (%) |
Recovery (%) |
|||||
| 1 | alpha-Trenbolone | H | P | 10.108 | 95 | 92 | 119 | 100 | 83 | 83 | 96 | 89 | 85 | 87 | 82 | 111 |
| 2 | beta-Trenbolone | H | P | 10.110 | 106 | 92 | 88 | 95 | 94 | 86 | 100 | 111 | 101 | 100 | 77 | 85 |
| 3 | Ciprofloxacin | Q | P | 5.912 | 72 | 63 | 70 | 72 | 65 | 70 | 74 | 77 | 73 | 70 | 68 | 94 |
| 4 | Clostebol | H | P | 11.337 | 86 | 94 | 87 | 95 | 84 | 90 | 87 | 86 | 74 | 85 | 87 | 96 |
| 5 | Danofloxacin | Q | P | 6.064 | 76 | 72 | 75 | 82 | 74 | 68 | 71 | 82 | 67 | 80 | 57 | 83 |
| 6 | Diaveridine | S | P | 5.486 | 69 | 94 | 69 | 96 | 59 | 91 | 70 | 87 | 84 | 85 | 61 | 104 |
| 7 | Difloxacin | Q | P | 6.969 | 88 | 80 | 85 | 81 | 77 | 73 | 86 | 90 | 67 | 80 | 85 | 85 |
| 8 | Enrofloxacin | Q | P | 6.308 | 81 | 83 | 78 | 85 | 79 | 75 | 103 | 87 | 82 | 69 | 75 | 92 |
| 9 | Flumequine | Q | P | 9.880 | 88 | 84 | 85 | 93 | 87 | 84 | 91 | 85 | 77 | 74 | 90 | 88 |
| 10 | Marbofloxacin | Q | P | 5.661 | 89 | 85 | 80 | 78 | 78 | 74 | 81 | 83 | 77 | 79 | 100 | 86 |
| 11 | Methylprednisolone | H | P | 9.435 | 107 | 102 | 88 | 109 | 88 | 78 | 97 | 87 | 112 | 83 | 91 | 82 |
| 12 | Nalidixic Acid | Q | P | 9.809 | 87 | 85 | 84 | 91 | 87 | 82 | 89 | 87 | 74 | 77 | 105 | 91 |
| 13 | Norfloxacin | Q | P | 5.762 | 74 | 65 | 69 | 70 | 59 | 48 | 84 | 75 | 75 | 76 | 72 | 93 |
| 14 | Ofloxacin | Q | P | 5.820 | 73 | 74 | 85 | 74 | 75 | 74 | 83 | 79 | 82 | 72 | 81 | 88 |
| 15 | Orbifloxacin | Q | P | 6.524 | 79 | 79 | 80 | 71 | 75 | 73 | 85 | 83 | 73 | 67 | 78 | 82 |
| 16 | Ormetoprim | S | P | 6.081 | 88 | 96 | 83 | 96 | 79 | 86 | 79 | 91 | 88 | 87 | 76 | 95 |
| 17 | Oxolinic Acid | Q | P | 8.866 | 86 | 93 | 82 | 98 | 88 | 82 | 88 | 96 | 77 | 82 | 63 | 93 |
| 18 | Piromidic acid | Q | P | 10.405 | 84 | 84 | 89 | 79 | 82 | 76 | 86 | 84 | 74 | 68 | 88 | 87 |
| 19 | Prednisolone | H | P | 8.941 | 92 | 107 | 92 | 92 | 93 | 89 | 99 | 97 | 89 | 95 | 69 | 95 |
| 20 | Pyrimethamine | S | P | 7.715 | 87 | 94 | 83 | 99 | 84 | 89 | 90 | 87 | 98 | 91 | 109 | 99 |
| 21 | Sarafloxacin | Q | P | 6.846 | 92 | 75 | 74 | 74 | 65 | 62 | 91 | 81 | 77 | 62 | 85 | 77 |
| 22 | Sulfabenzamide | S | P | 9.120 | 101 | 97 | 98 | 99 | 85 | 82 | 87 | 89 | 78 | 89 | 91 | 95 |
| 23 | Sulfabromomethazine Na | S | P | 9.898 | 99 | 98 | 108 | 111 | 87 | 91 | 91 | 97 | 87 | 98 | 84 | 87 |
| 24 | Sulfacetamide | S | P | 5.747 | 98 | 105 | 87 | 95 | 92 | 102 | 96 | 89 | 88 | 89 | 76 | 103 |
| 25 | Sulfachlorpyridazine | S | P | 8.119 | 96 | 94 | 99 | 94 | 92 | 88 | 93 | 96 | 80 | 95 | 98 | 98 |
| 26 | Sulfadiazine | S | P | 6.056 | 92 | 94 | 86 | 93 | 78 | 90 | 81 | 91 | 88 | 88 | 57 | 96 |
| 27 | Sulfadimethoxine | S | P | 9.171 | 105 | 105 | 89 | 100 | 91 | 93 | 92 | 92 | 91 | 86 | 94 | 96 |
| 28 | Sulfadimidine | S | P | 7.234 | 98 | 99 | 93 | 100 | 88 | 85 | 89 | 86 | 98 | 91 | 92 | 98 |
| 29 | Sulfadoxine | S | P | 8.429 | 98 | 98 | 90 | 105 | 93 | 92 | 91 | 89 | 91 | 89 | 91 | 96 |
| 30 | Sulfaethoxypyridazine | S | P | 8.398 | 94 | 99 | 84 | 99 | 88 | 82 | 90 | 94 | 89 | 91 | 100 | 99 |
| 31 | Sulfamerazine | S | P | 6.718 | 97 | 95 | 81 | 98 | 88 | 98 | 109 | 94 | 91 | 88 | 77 | 96 |
| 32 | Sulfamethoxazole | S | P | 8.472 | 99 | 103 | 88 | 99 | 93 | 105 | 85 | 84 | 96 | 90 | 91 | 93 |
| 33 | Sulfamethoxypyridazine | S | P | 7.165 | 98 | 102 | 90 | 99 | 87 | 86 | 88 | 92 | 89 | 104 | 92 | 100 |
| 34 | Sulfamonomethoxine | S | P | 7.726 | 96 | 92 | 93 | 100 | 90 | 88 | 96 | 98 | 89 | 90 | 99 | 95 |
| 35 | Sulfanitran | S | N | 9.736 | 108 | 104 | 108 | 93 | 103 | 91 | 98 | 96 | 101 | 86 | 110 | 92 |
| 36 | Sulfapyridine | S | P | 6.326 | 92 | 92 | 90 | 96 | 83 | 85 | 69 | 91 | 82 | 96 | 69 | 99 |
| 37 | Sulfaquinoxaline | S | P | 9.154 | 97 | 98 | 88 | 98 | 88 | 88 | 90 | 86 | 97 | 90 | 98 | 97 |
| 38 | Sulfathiazole | S | P | 6.047 | 88 | 94 | 85 | 99 | 72 | 76 | 84 | 91 | 76 | 90 | 61 | 94 |
| 39 | Sulfatroxazole | S | P | 8.597 | 93 | 87 | 100 | 105 | 99 | 95 | 89 | 87 | 92 | 90 | 79 | 95 |
| 40 | Sulfisomidine | S | P | 5.250 | 79 | 91 | 85 | 96 | 80 | 84 | 79 | 88 | 81 | 92 | 65 | 96 |
| 42 | Sulfisozole | S | P | 7.600 | 96 | 101 | 88 | 93 | 91 | 89 | 86 | 90 | 86 | 98 | 78 | 96 |
| 43 | Tiamulin | M | P | 9.210 | 99 | 98 | 95 | 99 | 86 | 89 | 89 | 89 | 96 | 95 | 79 | 97 |
| 44 | Tilmicosin (isomers) | M | P | 7.629 | 98 | 100 | 92 | 99 | 86 | 88 | 82 | 86 | 91 | 96 | 105 | 96 |
| 45 | Trimethoprim | S | P | 5.751 | 79 | 98 | 87 | 96 | 91 | 93 | 80 | 93 | 78 | 91 | 114 | 105 |
| 46 | Zeranol | H | P | 10.340 | 80 | 105 | 119 | 98 | 119 | 106 | 96 | 89 | 95 | 94 | 107 | 119 |
- Q: quinolones , S: sulfa drugs or antifolates, M: macrolides, H: hormones
- Ionization mode, P: Positive, N: Negative
- Measured values by AiSTI SCIENCE Co., Ltd.
- Recovery sample / solvent std x 100
- Recovery sample / matrix std x 100
Good recovery rates of 70 to 120% were obtained for 42 or more components in 3 types of meat, milk and chicken egg. With the frozen deep-fried chicken, the recovery rate of 70 to 120% was given by 39 components but it was less than 70% in the remaining 7 components. By calculating the recovery rate as the matrix std, the recovery rate was 70 to 120% in each component. This is probably because the samples recovered by the purification process were affected by ionization inhibition of matrix during measurement.
The recovery rate was about 70% for some components of quinolones. It was assumed that these substances were not sufficiently transferred to the solvent layer during extraction. In addition, this trend was prominent with beef, suggesting the influence of the difference in impurity composition in the samples.
Conclusions
By repetitive extractions with two types of solvents, acetonitrile and 5% formic acid-containing acetonitrile and adding up the extracts, components with different physical characteristics could be pretreated at the same time. In addition, quantitativeness could be ensured by adding up the two extracts and then doing constant volume.
In purification process, by using the dedicated fully automated solid-phase extractor system ST-L400, the complicated process could be performed quickly and easily.
In this recovery test, not only meat but also milk, chicken eggs, and processed foods (deep-fried chicken) were able to obtain generally good results with a uniform standard concentration.
In this study, we proposed pretreatment methods for veterinary drugs, and demonstrated that they could be analyzed quickly, easily, and in highly purified manner for the respective samples.
References
- Shima M. et al.: Proceedings of the 114th Meeting of the Japanese Society for Food Hygiene and Safety, p.124 (2018).
- Shima M. et al.: Proceedings of the 115th Meeting of the Japanese Society for Food Hygiene and Safety, p.110 (2019).