NMR
NMR spectroscopy is used in qualitative analysis mainly for molecular structure analysis in fields such as organic chemistry and natural product chemistry since it can estimate molecular structures from the information such as chemical shift of signals, coupling-pattern and intramolecular signal area. When electromagnetic waves are irradiated on a substance placed in a magnetic field, absorption and emission of electromagnetic waves (radio waves) at frequencies specific to the atomic nuclei in the substance occur. This phenomenon is called Nuclear Magnetic Resonance (NMR). NMR spectroscopy (also called simply NMR) is a method to record the frequencies of electromagnetic waves absorbed based on the characteristics of atomic nuclei as a function of the absorption peak intensity and the record is an NMR spectrum. In real compounds, resonant absorption occurs at different frequencies for the same type of atomic nucleus (1H, 13C, etc.) if the surrounding chemical environments are different. This is caused by the increase or decrease in the strength of the magnetic field due to shielding of the main magnetic field by a small magnetic field by electrons present near the nucleus and adjacent nuclei. The deviations in the resonance frequency thus caused are called chemical shifts. Although this frequency shift is slight, accurate measurement of this slight shift provides information on the compound.
More Information
Principle
When electromagnetic waves are irradiated on a substance placed in a magnetic field, absorption and emission of electromagnetic waves (radio waves) at frequencies specific to the atomic nuclei in the substance occur. This phenomenon is called Nuclear Magnetic Resonance (NMR). NMR spectroscopy (also called simply NMR) is a method to record the frequencies of electromagnetic waves absorbed based on the characteristics of atomic nuclei as a function of the absorption peak intensity and the record is an NMR spectrum.
Information Obtained from NMR Spectrum
Chemical shift (δ)
In real compounds, resonant absorption occurs at different frequencies for the same type of atomic nucleus (1H, 13C, etc.) if the surrounding chemical environments are different. This is caused by the increase or decrease in the strength of the magnetic field due to shielding of the main magnetic field by a small magnetic field by electrons present near the nucleus and adjacent nuclei. The deviations in the resonance frequency thus caused are called chemical shifts. Although this frequency shift is slight, accurate measurement of this slight shift provides information on the compound. Chemical shifts in ordinary 1H NMR measurements are recorded at ppm scale relative to the methyl group of tetramethylsilane (TMS) (δ = 0). It is known as a rough guide from the past measurement examples that what kind of partial structure shows what kind of chemical shift value, and it is possible to identify the structure of a compound from the chemical shift.
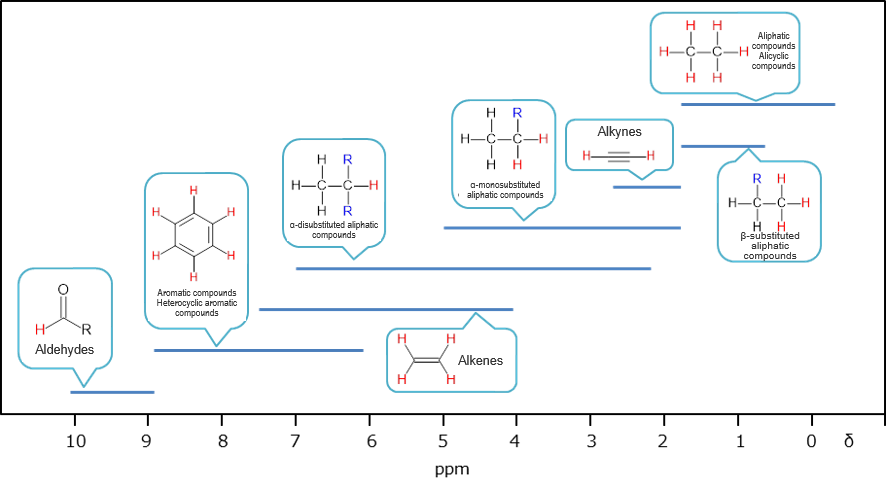
General regions of chemical shifts (Some of aldehydes, enols, and most carboxylic acids exhibit absorptions at the higher frequencies than δ10.)1)
Coupling-pattern and spin-spin coupling constant (J)
Chemically non-equivalent nuclides, if present in close proximity, mutually affect resulting in the division of the energy level. This phenomenon is called coupling. On a 1H NMR chart, the peak of Ha is observed in (n + 1) divisions when n equivalent protons, Hb, are present next to Ha. Each peak is presented by the following symbol depending on the number of signals.
- Single line: Singlet (singlet, s)
- Double line: Doublet (doublet, d)
- Triple line: Triplet (triplet, t)
- Quadruple line: Quartet (quartet, q)
- Broad line: Broad (broad, br)
In the following compound, for example, there are three chemically equivalent Hb next to Ha. Because of this, the peak of Ha is a quartet (q) divided into 3 + 1 = 4. Looking from Hb, on the other hand, there are two chemically equivalent Ha next to Hb, thus, the peak of Hb is a triplet (t) divided into 2 + 1 = 3.
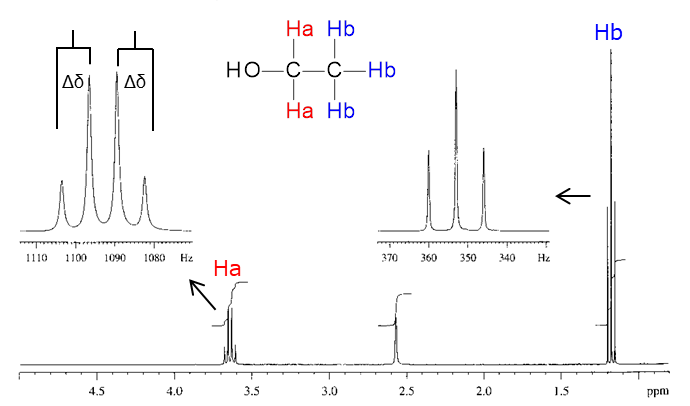
The interval between the coupled peaks is described as the spin-spin coupling constant (J value). Since the coupled nuclides share exactly the same J value, the J value is an indicator to find which nuclides are in close proximity. The J value is calculated by the following equation.
J (Hz) = Measurement frequency (Hz) x difference in chemical shift (Δδ, ppm)
Example: When 1H NMR is measured by a 500 MHz instrument and the chemical shift difference is Δδ = 0.015 ppm, the J value can be calculated as (500 x 106) x (0.015 x 10−6) = 7.5 Hz.
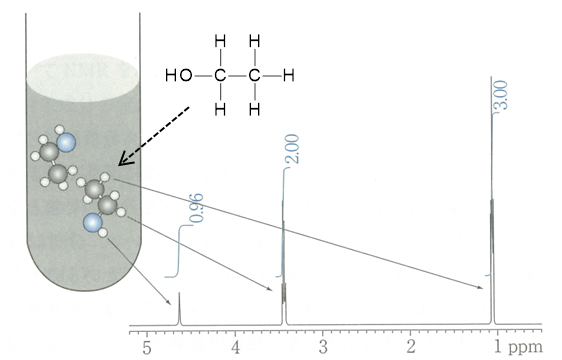
Signal area
The area of each peak obtained after Fourier transformation corresponds to the abundance ratio of nuclides. Because of high quantitativity in the case of 1H NMR, the abundance ratio of protons in the same environment can be calculated by determining the signal area. Recently, the quantitative NMR (qNMR) method is drawing attention for determination of the purity of a compound utilizing the characteristics of correspondence between the ratio of the number of atomic nuclei in a compound and the ratio of signal areas in NMR.
- Shun, A., et al.: “Spectrometric Identification of Organic Compounds (7th Edition)” (Tokyo Kagaku Dojin) (2006)
- "qNMR Primary Guide" working group: "qNMR Primary Guide -From Basic to Practice-" (Kyoritsu Shuppan) (2015)
This article summarizes chemical information intermingled on the web, and organizes and provides them with the cooperation of the chemical portal site "Chem-Station". About Chem-Station
For research use or further manufacturing use only. Not for use in diagnostic procedures.
Product content may differ from the actual image due to minor specification changes etc.
If the revision of product standards and packaging standards has been made, there is a case where the actual product specifications and images are different.
The prices are list prices in Japan.Please contact your local distributor for your retail price in your region.