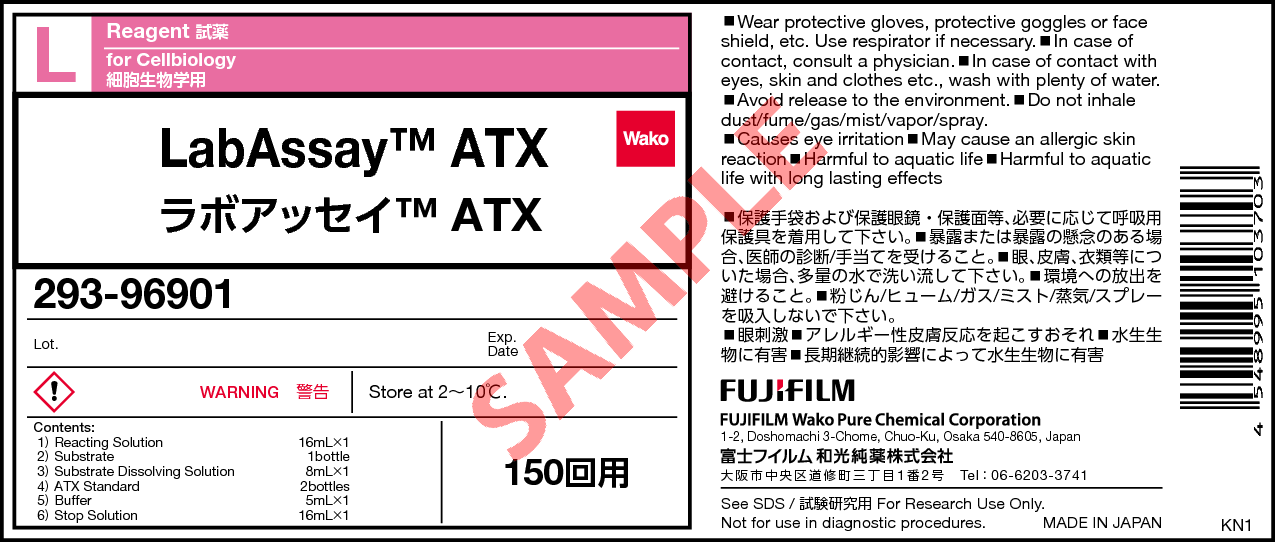
LabAssay™ ATX
- for Cellbiology
- Manufacturer :
- FUJIFILM Wako Pure Chemical Corporation
- Storage Condition :
- Keep at 2-10 degrees C.
- GHS :
-


-
 Close
Close -
 Close
Close
- Structural Formula
- Label
- Packing
- SDS
|
Comparison
|
Product Number
|
Package Size
|
Price
|
Inventory
|
|
|---|---|---|---|---|---|
|
|
|
150Tests
|
|
Please check here for notes on products and prices.
Document
Kit component
For 150 tests
| Reacting Solution | 16 mL/1 bottle |
|---|---|
| Substrate | For 8 mL/1 bottle |
| Substrate Dissolving Solution | 8 mL/1 bottle |
| ATX Standard | 2 bottles |
| Buffer | 5 mL/1 bottle |
| Stop Solution | 16 mL/1 bottle |
Product Overview
Autotaxin (ATX) is a glycoprotein with a molecular weight of 125 kDa that was isolated as a cell migration promoting factor from the cell culture supernatant of human malignant melanoma cells. It is known that liver damage such as fibrosis causes metabolic inhibition of ATX, which leads to retention of ATX in the blood, resulting in an increase in its blood concentration.
LabAssay™ ATX is a kit designed to measure ATX in samples. With the use of a microplate, this kit provides a convenient method for measuring ATX in samples.
Kit Performance
| Analysis sample | Human Serum/Plasma (heparin) Mouse Serum/Plasma (heparin) Rat Serum/Plasma (heparin) Culture medium (D-MEM)* |
|---|---|
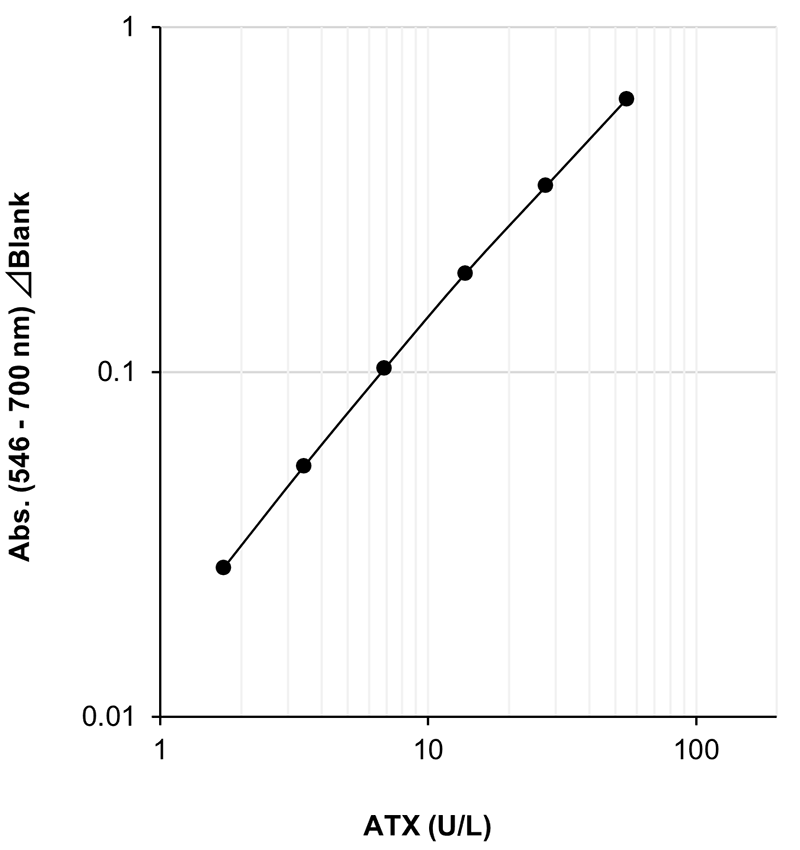
| Calibration curve range | 1.72-55 U/L |
| Sample volume | 10 μL |
| Measurement duration | Approx. 40 min |
| Wavelength | Primary wavelength 546 nm Reference wavelength 700 nm |
Measurement availability depends on the culture medium, cell type and culture conditions. Please perform a spiked recovery test or dilution linearity test in advance using the culture medium to be used in your experiment.
Example of Calibration Curve
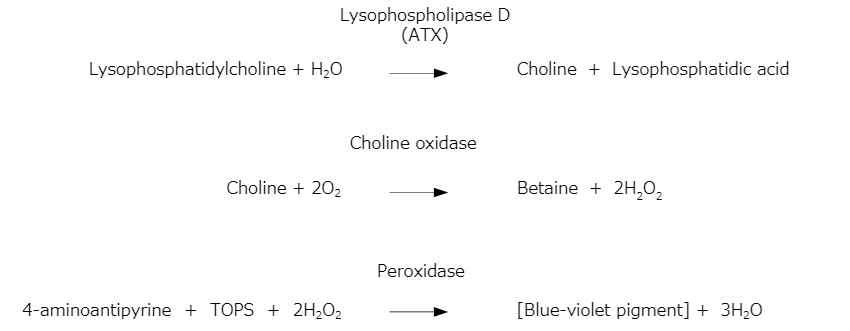
Assay Principle
Lysophosphatidylcholine is hydrolyzed by the lysophospholipase D activity of ATX in the sample to form choline. The resultant choline is oxidized by the action of choline oxidase (COD) to form hydrogen peroxide. The resultant hydrogen peroxide oxidatively condenses N-Ethyl-N-(3-sulfopropyl)-3-methylaniline (TOPS) and 4-aminoantipyrine quantitatively through the action of peroxidase (POD) to produce a blue-violet pigment. The reaction is stopped by addition of the Stop Solution and absorbance is measured to determine ATX activity in the sample.
Data
Repeatability (within run precision)
Repeatability was conducted by measuring five-fold assays of serum/plasma (heparin) samples from human, mouse and rat at two concentrations with this product.
| n\ID | Human serum | Human plasma (heparin) | Mouse serum | Mouse plasma (heparin) | Rat serum | Rat plasma (heparin) | ||||||
|---|---|---|---|---|---|---|---|---|---|---|---|---|
| ID1 (U/L) | ID2 (U/L) | ID3 (U/L) | ID4 (U/L) | ID1 (U/L) | ID2 (U/L) | ID3 (U/L) | ID4 (U/L) | ID1 (U/L) | ID2 (U/L) | ID3 (U/L) | ID4 (U/L) | |
| 1 | 24.5 | 6.31 | 26.3 | 6.75 | 36.4 | 6.64 | 35.0 | 5.92 | 25.6 | 9.95 | 24.2 | 10.3 |
| 2 | 24.5 | 6.55 | 26.4 | 6.94 | 37.3 | 6.58 | 35.0 | 5.92 | 24.0 | 9.82 | 24.0 | 10.3 |
| 3 | 25.1 | 6.44 | 26.8 | 6.89 | 36.3 | 6.73 | 34.9 | 5.97 | 23.9 | 10.2 | 24.7 | 10.6 |
| 4 | 25.2 | 6.61 | 26.8 | 7.06 | 37.2 | 6.70 | 34.9 | 5.95 | 24.5 | 10.0 | 24.5 | 10.5 |
| 5 | 25.1 | 6.43 | 26.7 | 6.86 | 36.2 | 6.66 | 34.9 | 5.93 | 24.5 | 10.0 | 24.5 | 10.5 |
| mean | 24.9 | 6.47 | 26.6 | 6.90 | 36.7 | 6.66 | 34.9 | 5.94 | 24.5 | 10.0 | 24.4 | 10.4 |
| SD | 0.349 | 0.116 | 0.235 | 0.113 | 0.526 | 0.0576 | 0.0548 | 0.0238 | 0.675 | 0.137 | 0.277 | 0.134 |
| CV(%) | 1.4 | 1.8 | 0.9 | 1.6 | 1.4 | 0.9 | 0.2 | 0.4 | 2.8 | 1.4 | 1.1 | 1.3 |
[Result]
The CV (%) of human serum was 1.4-1.8%, human plasma (heparin) was 0.9-1.6%, mouse serum was 0.9-1.4%, mouse plasma (heparin) was 0.2-0.4%, rat serum was 1.4-2.8% and rat plasma (heparin) was 1.1-1.3%, indicating good repeatability.
Reproducibility (between run precision)
Reproducibility was conducted by measuring serum/plasma (heparin) samples from human, mouse and rat at three concentrations each for four days with this product.
| Day\ID | Human serum | Human plasma (heparin) | Mouse serum | Mouse plasma (heparin) | Rat serum | Rat plasma (heparin) | ||||||||||||
|---|---|---|---|---|---|---|---|---|---|---|---|---|---|---|---|---|---|---|
| ID9 (U/L) | ID10 (U/L) | ID11 (U/L) | ID12 (U/L) | ID13 (U/L) | ID14 (U/L) | ID7 (U/L) | ID8 (U/L) | ID9 (U/L) | ID10 (U/L) | ID11 (U/L) | ID12 (U/L) | ID7 (U/L) | ID8 (U/L) | ID9 (U/L) | ID10 (U/L) | ID11 (U/L) | ID12 (U/L) | |
| 1 | 24.4 | 18.2 | 13.7 | 26.3 | 18.7 | 14.0 | 41.1 | 20.6 | 9.88 | 39.8 | 20.0 | 9.32 | 21.7 | 15.9 | 11.8 | 21.2 | 15.1 | 10.6 |
| 2 | 24.6 | 18.3 | 13.8 | 26.5 | 18.7 | 14.0 | 40.9 | 20.4 | 9.82 | 39.5 | 19.9 | 9.31 | 22.0 | 16.0 | 11.9 | 21.3 | 15.2 | 10.8 |
| 3 | 23.6 | 17.5 | 13.8 | 25.4 | 18.3 | 14.6 | 40.0 | 20.2 | 10.1 | 40.1 | 20.2 | 9.90 | 22.7 | 16.6 | 13.0 | 22.3 | 15.6 | 11.7 |
| 4 | 23.6 | 17.5 | 13.8 | 25.4 | 18.3 | 14.6 | 39.4 | 20.1 | 10.1 | 39.4 | 20.1 | 9.88 | 22.8 | 16.9 | 13.1 | 22.5 | 15.7 | 11.8 |
| mean | 24.1 | 17.9 | 13.8 | 25.9 | 18.5 | 14.3 | 40.4 | 20.3 | 10.0 | 39.7 | 20.1 | 9.60 | 22.3 | 16.4 | 12.5 | 21.8 | 15.4 | 11.2 |
| SD | 0.526 | 0.435 | 0.0500 | 0.583 | 0.231 | 0.346 | 0.794 | 0.222 | 0.146 | 0.316 | 0.129 | 0.332 | 0.535 | 0.480 | 0.695 | 0.670 | 0.294 | 0.613 |
| CV(%) | 2.2 | 2.4 | 0.4 | 2.3 | 1.2 | 2.4 | 2.0 | 1.1 | 1.5 | 0.8 | 0.6 | 3.5 | 2.4 | 2.9 | 5.6 | 3.1 | 1.9 | 5.5 |
[Result]
The CV (%) of human serum was 0.4-2.4%, human plasma (heparin) was 1.2-2.4%, mouse serum was 1.1-2.0%, mouse plasma (heparin) was 0.6-3.5%, rat serum was 2.4-5.6% and rat plasma (heparin) was 1.9-5.5%, indicating good reproducibility.
Dilution Linearity Test
Serum and plasma (heparin) from human, mouse and rat, as well as D-MEM spiked with the standard, were serially diluted twofold with saline and measured in duplicate to assess linearity.
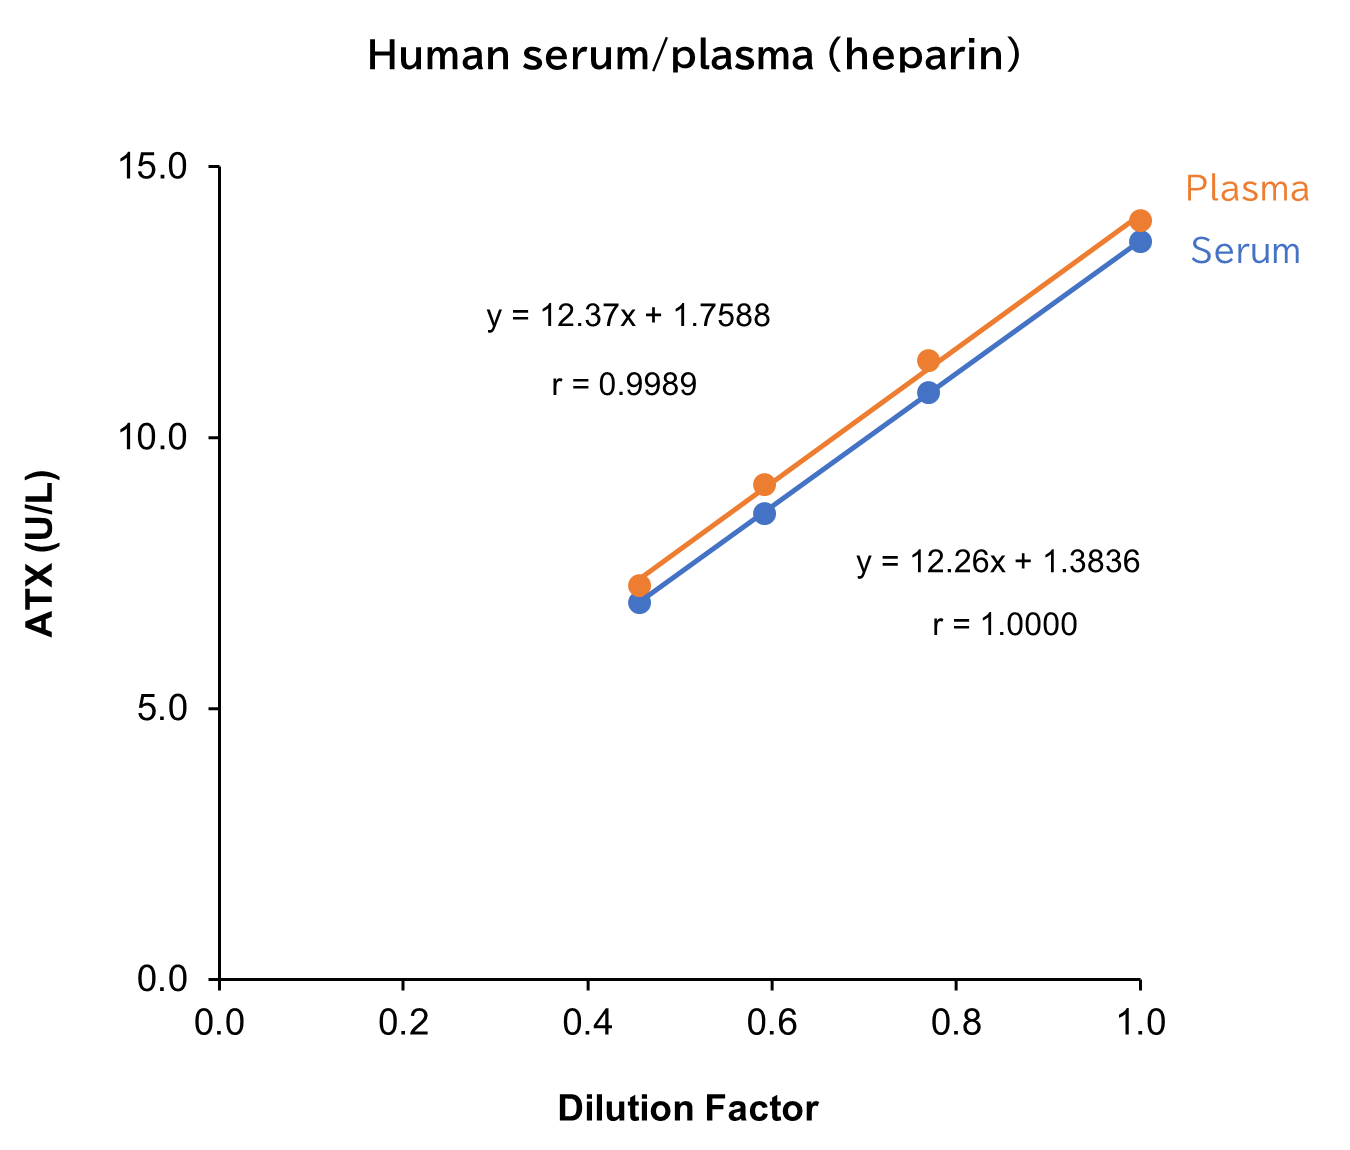
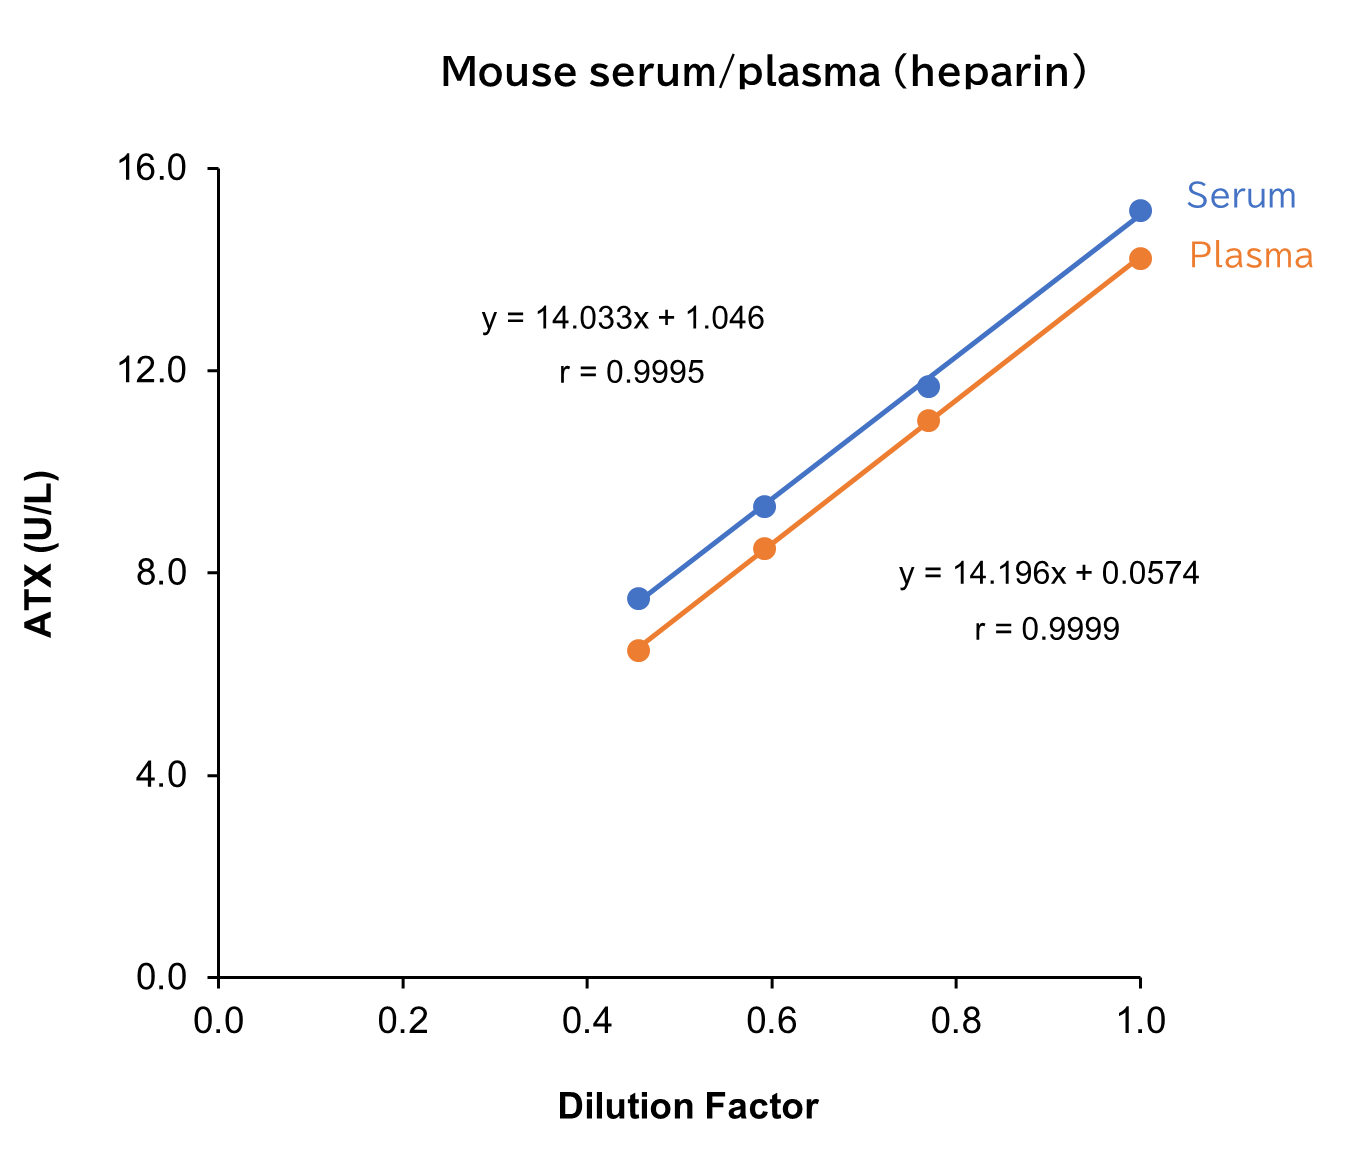
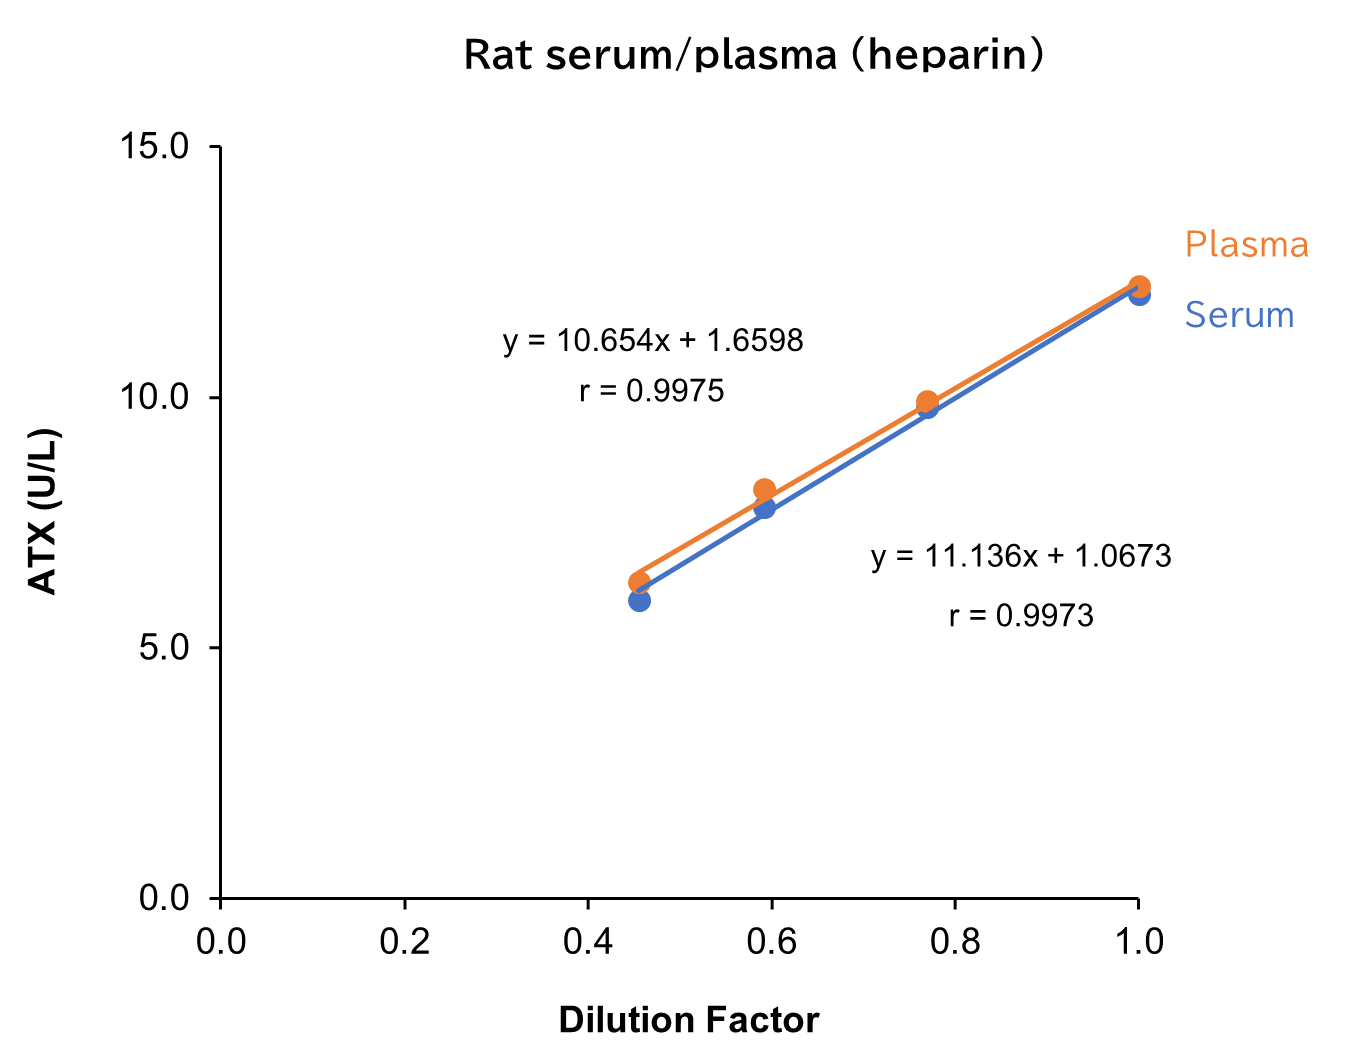
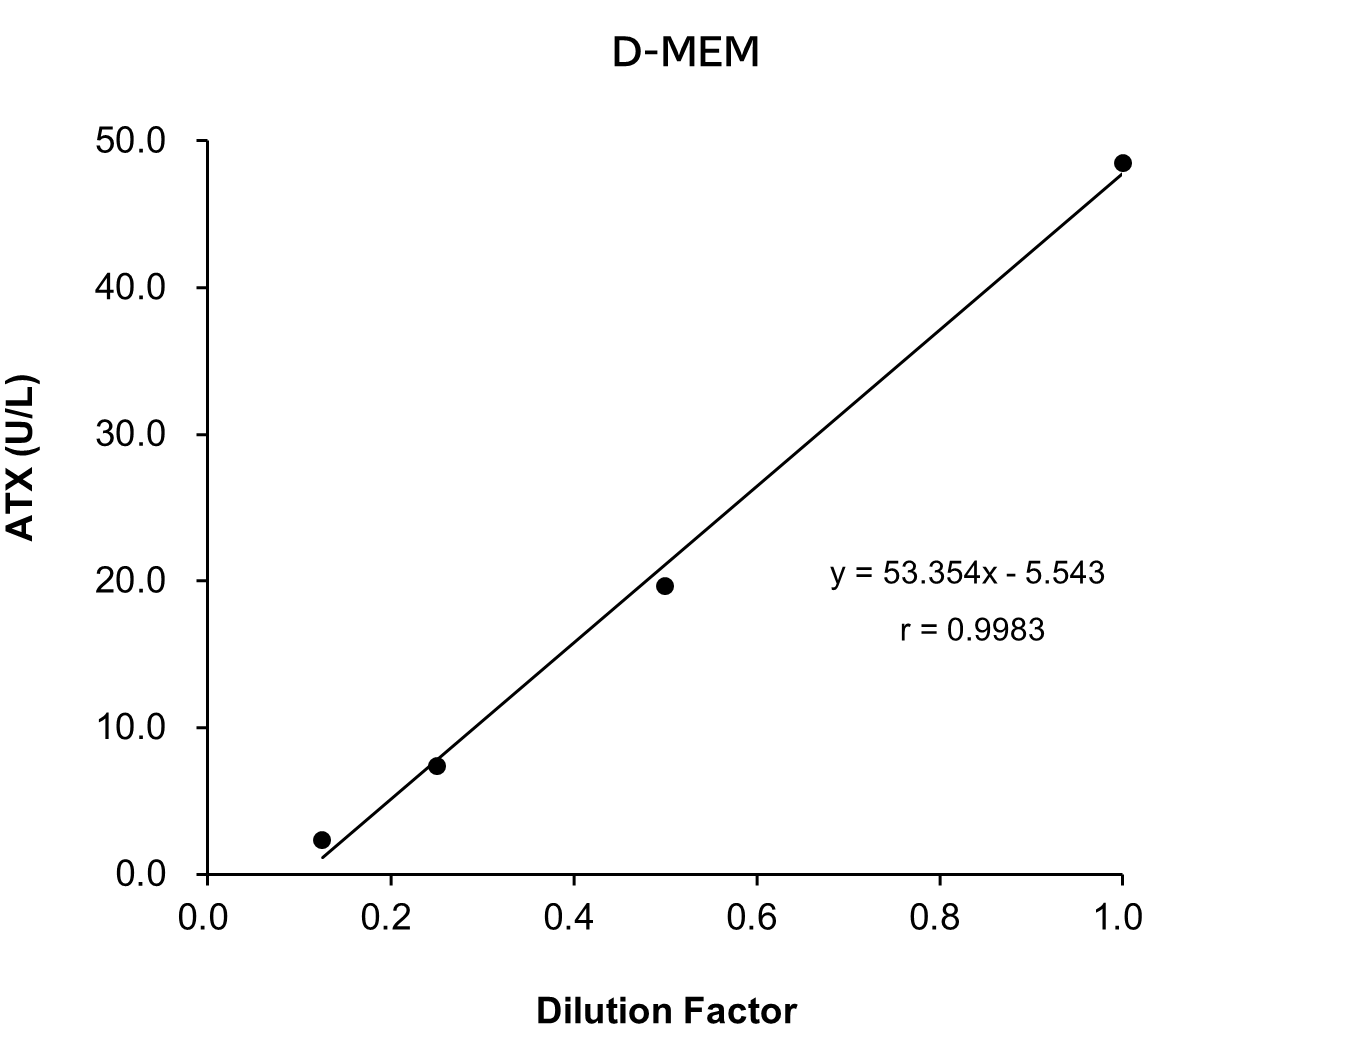
[Result]
All measurement results showed good linearity within the measurement range.
Spike and Recovery Test
Standard solutions at three concentrations were added to serum/plasma (heparin) from human, mouse and rat. Next, spike recovery tests were conducted, with each measurement performed in duplicate.
Human sample
| Spiked amount (U/L) |
Measurement value (U/L) |
Recovery volume (U/L) |
Recovery rate (%) |
|
|---|---|---|---|---|
| Serum | - | 5.95 | - | - |
| 8.05 | 13.8 | 7.85 | 97.5 | |
| 24.2 | 28.2 | 22.3 | 92.1 | |
| 40.3 | 44.9 | 39.0 | 96.8 | |
| Average | 95.5 | |||
| Plasma (heparin) |
- | 7.29 | - | - |
| 7.69 | 14.6 | 7.31 | 95.1 | |
| 23.1 | 28.6 | 21.3 | 92.2 | |
| 38.5 | 46.9 | 39.6 | 103 | |
| Average | 96.8 | |||
Mouse sample
| Spiked amount (U/L) |
Measurement value (U/L) |
Recovery volume (U/L) |
Recovery rate (%) |
|
|---|---|---|---|---|
| Serum | - | 10.1 | - | - |
| 6.08 | 16.8 | 6.70 | 110 | |
| 12.2 | 21.6 | 11.5 | 94.3 | |
| 24.3 | 32.8 | 22.7 | 93.4 | |
| Average | 99.3 | |||
| Plasma (heparin) |
- | 11.2 | - | - |
| 6.57 | 17.6 | 6.40 | 97.4 | |
| 13.1 | 23.8 | 12.6 | 95.9 | |
| 26.3 | 36.4 | 25.2 | 95.9 | |
| Average | 96.4 | |||
Rat sample
| Spiked amount (U/L) |
Measurement value (U/L) |
Recovery volume (U/L) |
Recovery rate (%) |
|
|---|---|---|---|---|
| Serum | - | 10.5 | - | - |
| 7.42 | 18.0 | 7.50 | 101 | |
| 14.8 | 24.3 | 13.8 | 93.0 | |
| 29.7 | 38.5 | 28.0 | 94.4 | |
| Average | 96.2 | |||
| Plasma (heparin) |
- | 10.7 | - | - |
| 7.48 | 18.0 | 7.30 | 97.6 | |
| 15.0 | 24.2 | 13.5 | 90.2 | |
| 29.9 | 38.1 | 27.4 | 91.6 | |
| Average | 93.1 | |||
[Result]
Good recovery rates were confirmed.
Correlation with Automated Analyzer Reagents
ATX levels in serum/plasma (heparin) sample from human, mouse and rat were measured using LabAssay™ ATX (this product) and reagents for automated analyzers, and the correlation between the two sets of results was evaluated.
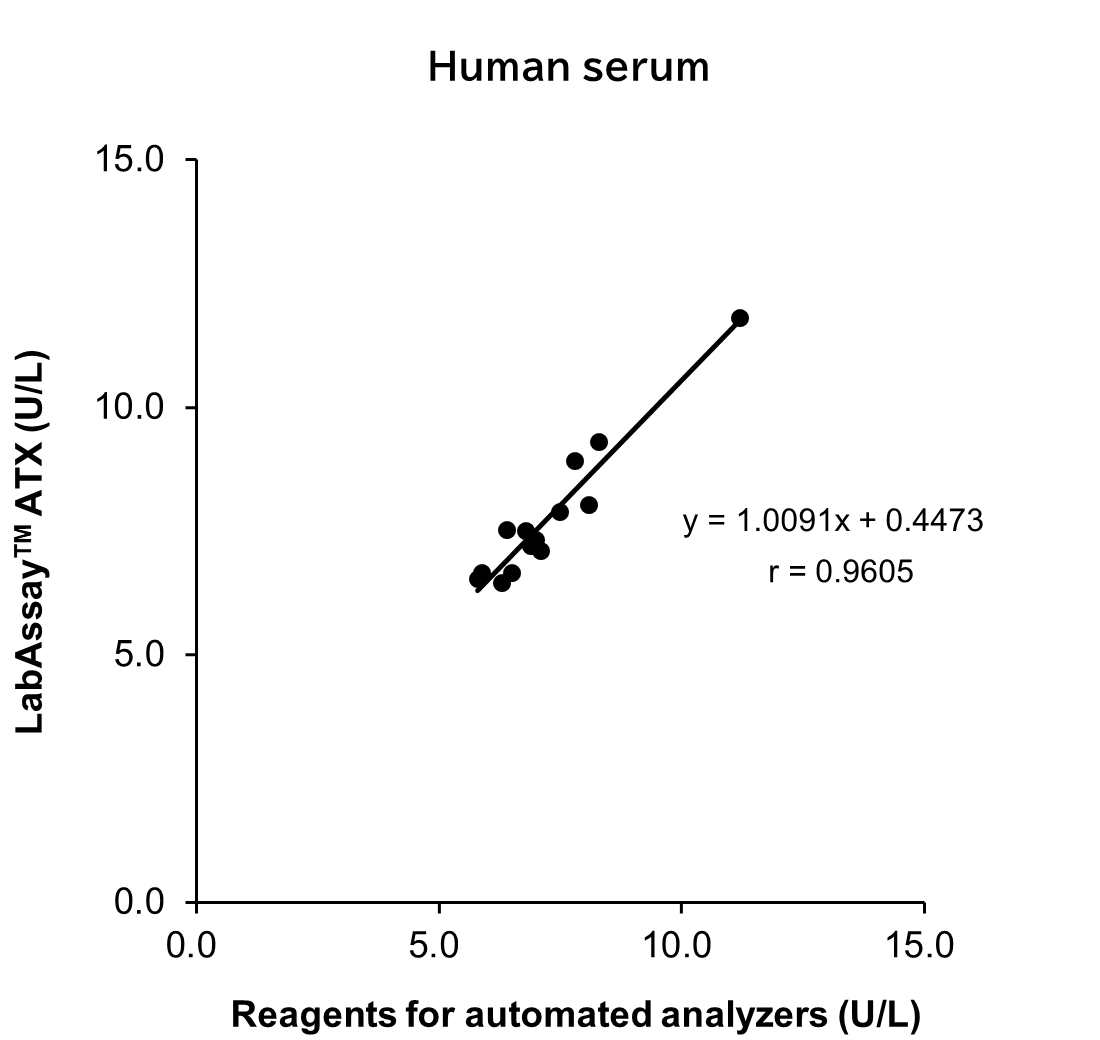
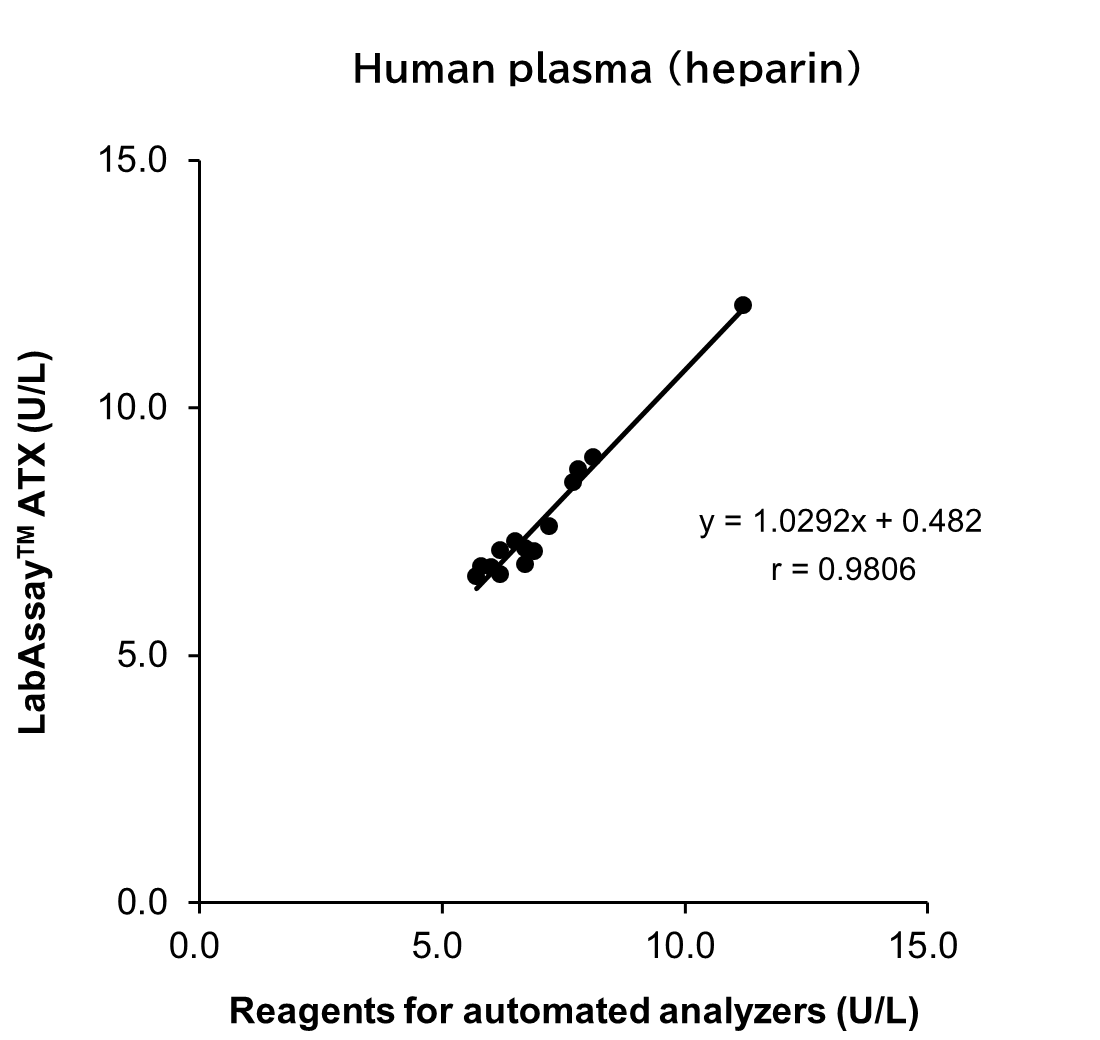
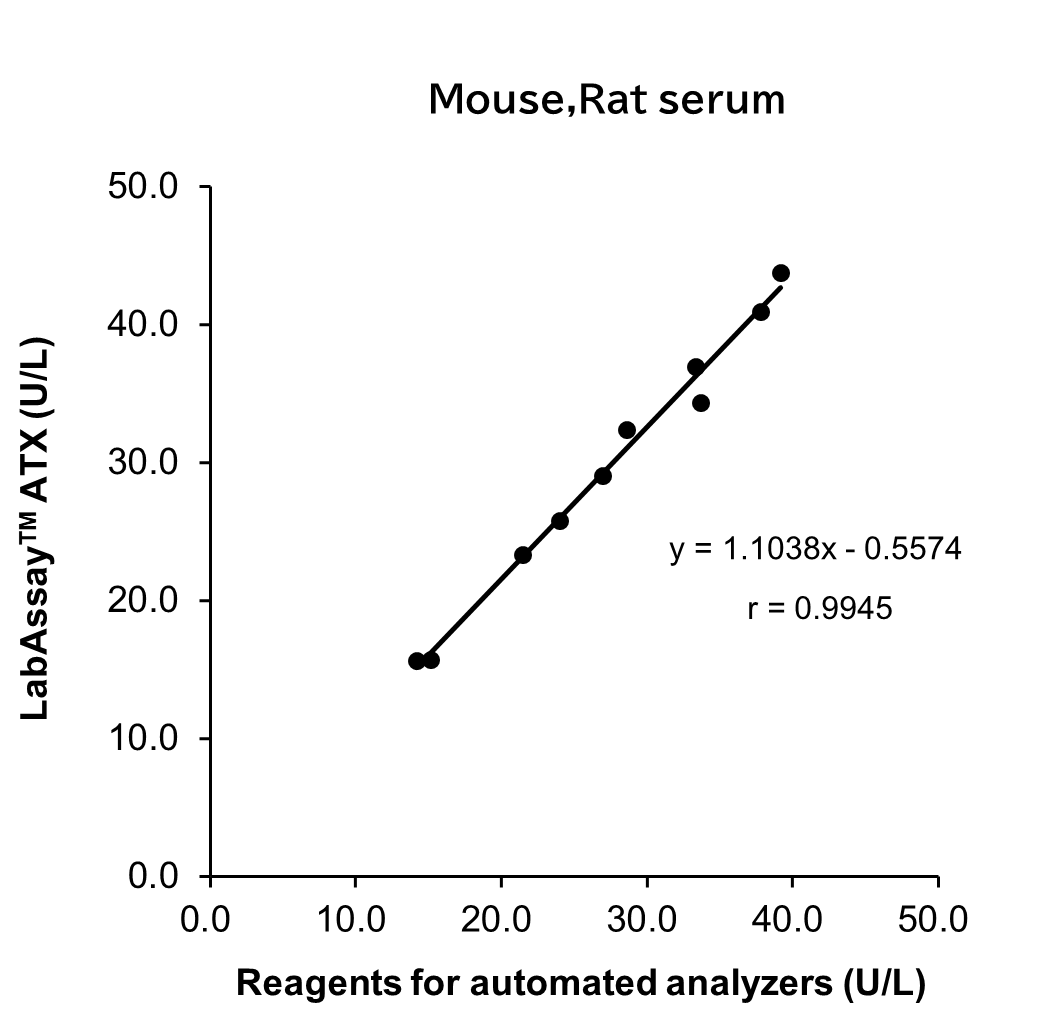
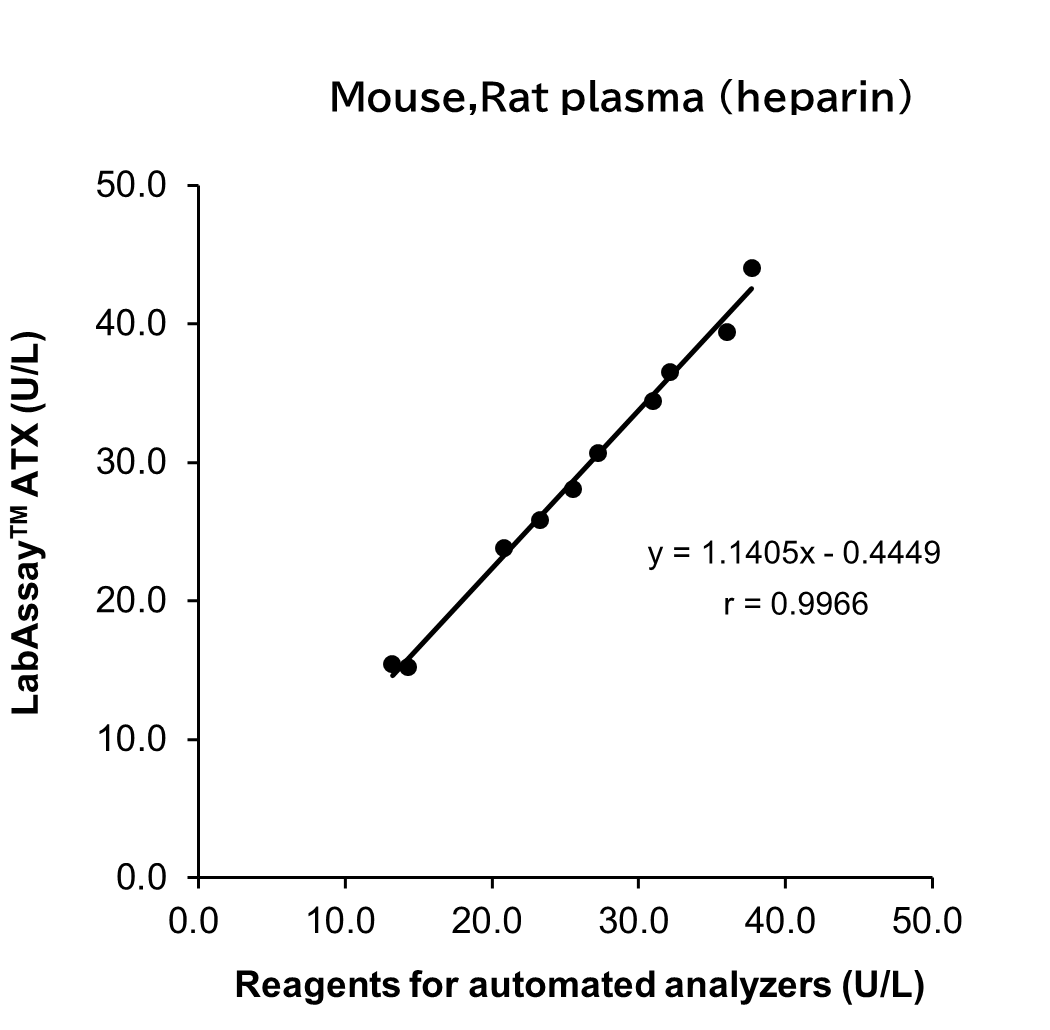
[Result]
A strong correlation was confirmed between the values obtained with LabAssay™ ATX and those obtained using reagents for automated analyzers.
Correlation with products from other competitors
Measurements were conducted on the same samples of serum/plasma (heparin) from human using this kit and competitor's product R. The measurement values obtained using both products were then compared.
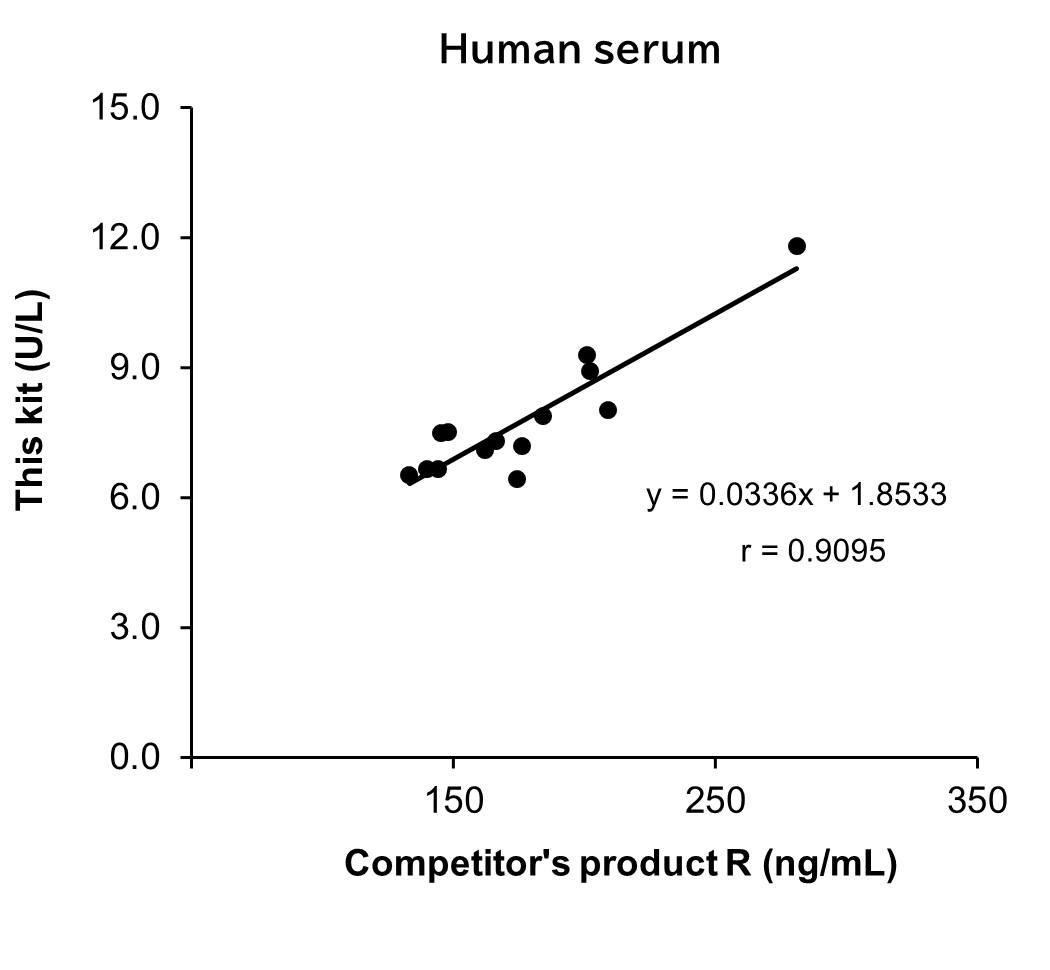
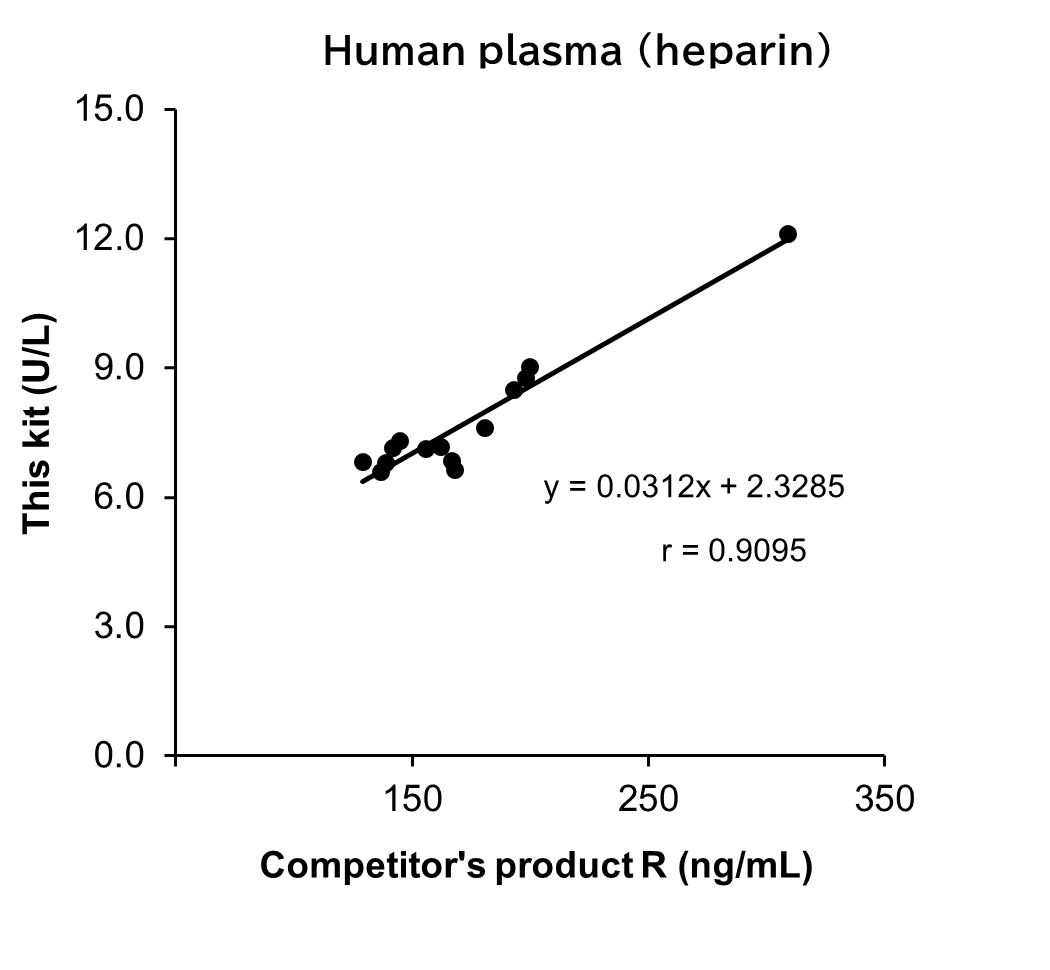
| sample No. | Human serum | sample No. | Human plasma (heparin) | ||
|---|---|---|---|---|---|
| This kit (U/L) | Competitor's product R (ng/mL) | This kit (U/L) | Competitor's product R (ng/mL) | ||
| 1 | 8.03 | 209 | 15 | 8.49 | 193 |
| 2 | 8.92 | 202 | 16 | 8.76 | 198 |
| 3 | 7.10 | 162 | 17 | 7.11 | 156 |
| 4 | 7.52 | 148 | 18 | 7.13 | 142 |
| 5 | 6.53 | 133 | 19 | 6.79 | 139 |
| 6 | 9.29 | 201 | 20 | 9.01 | 200 |
| 7 | 7.88 | 184 | 21 | 7.60 | 181 |
| 8 | 7.19 | 176 | 22 | 6.84 | 167 |
| 9 | 6.44 | 174 | 23 | 6.64 | 168 |
| 10 | 11.8 | 281 | 24 | 12.1 | 309 |
| 11 | 6.65 | 140 | 25 | 6.81 | 129 |
| 12 | 6.65 | 144 | 26 | 6.59 | 137 |
| 13 | 7.31 | 166 | 27 | 7.17 | 162 |
| 14 | 7.50 | 145 | 28 | 7.30 | 145 |
[Result]
A good correlation was confirmed. In addition, competitor's product R required dilution of all samples because the values were outside the calibration curve range. On the other hand, This kit could measure within the calibration curve range without diluting the samples.
FAQ
About sample
- What samples should I use?
- Analyze samples immediately after collection. If it is difficult to analyze immediately, store frozen until analysis. Hemolysis may influence the assay.
- Is it possible to measure in cell culture supernatant?
- Yes. However, measurement availability depends on the culture medium, cell type and culture conditions. When using cell culture supernatant as a sample, please perform a spiked recovery test or dilution linearity test in advance using the culture medium to be used in your experiment.
- Which anticoagulants can I use?
- The anticoagulant heparin does not significantly influence the assay when used in normal amounts. Do not use EDTA because it influences the assay.
- What should I do with samples that exceed the measurable range?
- Dilute samples with saline and repeat the assay if the measured value exceeds the measurable range, and multiply the result by the dilution factor.
- Does ascorbic acid affect the measured values?
- Ascorbic acid does not affect the assay up to 10 mg/dL.
About kit usage
- What instruments, and equipment are required for the assay using this kit?
- The instruments and equipment required for the use of this kit are listed below.
- 96-well microplate (transparent type)
- Micropipette
- Microtube
- Pipette
- Incubator maintained at 37℃
- Plate mixer
- Microplate reader (with 546 nm/700 nm wavelength filter)
- What is the amount of purified water to be added to the standard product?
- Find and check “Reconstitution of standard” on this product page. As the amount of purified water to be added varies by lot, be sure to check it for every lot.
- What are the storage conditions and shelf-life guidelines for each reagent?
- Reacting Solution :
Ready to use. After opening the bottle, store at 2°C - 10°C and use within 4 weeks.
Substrate Solution :
Reconstitute 1 bottle of Substrate with 8 mL of Substrate Dissolving Solution to make the Substrate Solution. After preparation, store at 2°C - 10°C and use within 4 weeks.
ATX Standard :
Ready to use. After preparing each concentration of the standard solution, use immediately and do not store.
Stop Solution :
Ready to use. After opening the bottle, store at 2°C - 10°C.
*If crystals have formed, return to room temperature, stir, and completely dissolve before use.
Overview / Applications
Property
Manufacturer Information
Alias
- LabAssay
ENPP2
ENPP-2
ectonucleotide pyrophosphatase
phosphodiesterase
Lysophospholipase D
lysoPLD
autotaxin
For research use or further manufacturing use only. Not for use in diagnostic procedures.
Product content may differ from the actual image due to minor specification changes etc.
If the revision of product standards and packaging standards has been made, there is a case where the actual product specifications and images are different.
The prices are list prices in Japan.Please contact your local distributor for your retail price in your region.