LabAssay (TM) Glucose
- for Cellbiology
- Manufacturer :
- FUJIFILM Wako Pure Chemical Corporation
- Storage Condition :
- Keep at 2-10 degrees C.
- GHS :
-


-
 Close
Close
- Structural Formula
- Label
- Packing
- SDS
|
Comparison
|
Product Number
|
Package Size
|
Price
|
Inventory
|
|
|---|---|---|---|---|---|
|
|
|
500Tests
|
|
In stock in Japan |
Please check here for notes on products and prices.
Document
Kit component
For 500 tests
| Buffer Solution | 150 mL/1 bottle |
|---|---|
| Chromogen Substrate | For 150 mL/1 bottle |
| Standard Solution I | 3 mL/1 bottle |
| Standard Solution II | 3 mL/1 bottle |
Product Overview
Sugar is one of the most important sources of energy in biology. It is regulated by various factors within an organism. Glucose converges to a stable ratio of α-form and β-form in solutions.
LabAssay™ Glucose is a kit designed to measure glucose in samples based on an enzymatic method with a combination of mutarotase and glucose oxidase.
Kit Performance
| Analysis sample | Human Serum/Plasma Mouse Serum/Plasma Rat Serum/Plasma Dog Serum/Plasma Cat Serum/Plasma |
|---|---|
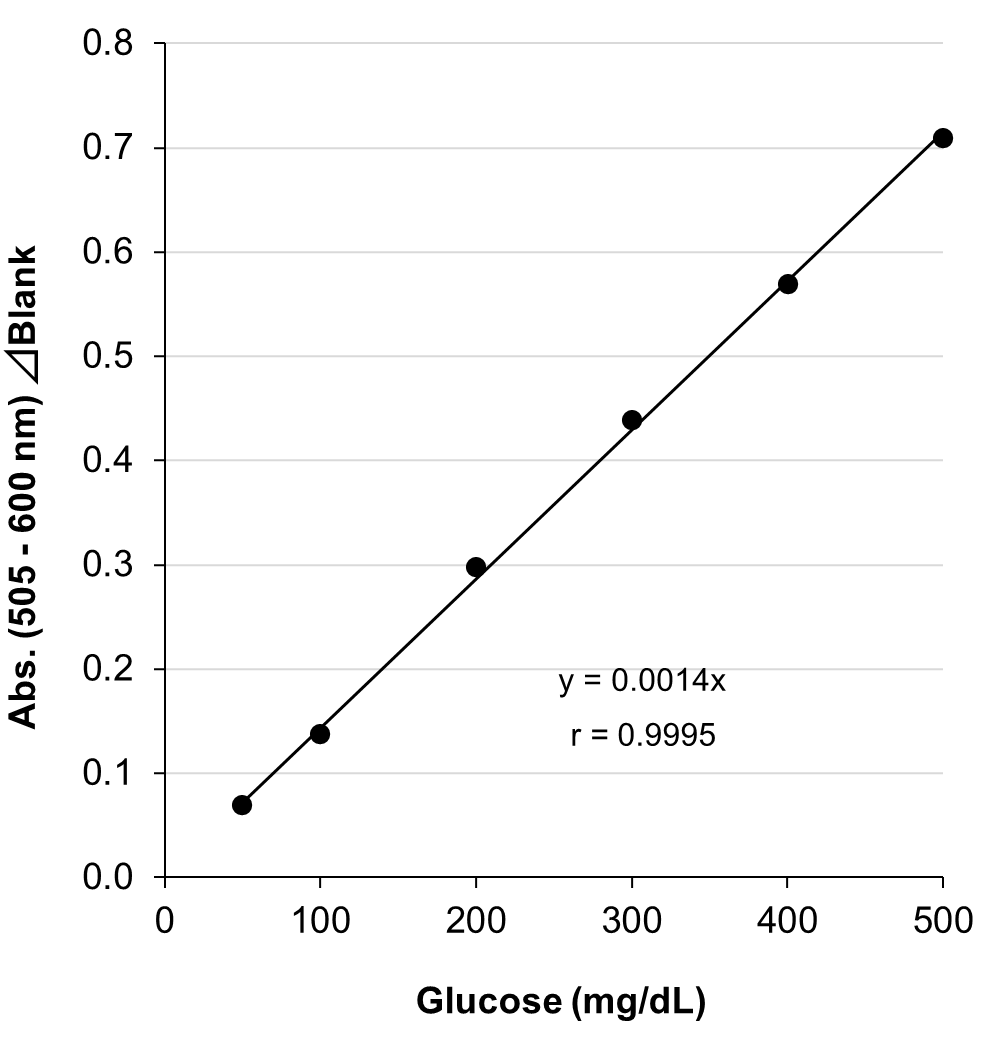
| Calibration curve range | 50-500 mg/dL |
| Sample volume | 2 μL |
| Measurement duration | Approx. 10 min |
| Wavelength | Primary wavelength 505 nm Reference wavelength 600 nm |
Example of Calibration Curve
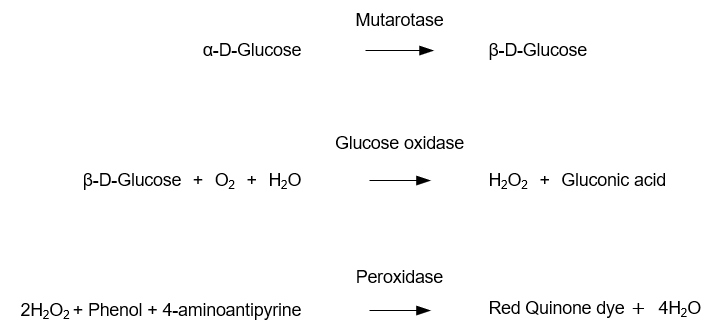
Assay Principle
α-D-Glucose is converted to β-D-Glucose by mutarotase. Hydrogen peroxide, which is produced by a reaction between β-D-Glucose and glucose oxidase (GOD), promotes oxidative condensation of phenol with 4-aminoantipyrine quantitatively. LabAssay™ Glucose is a kit used for the quantitative determination of glucose concentrations in samples by measuring absorbance of a red color which is generated by the oxidative condensation reaction.
Procedure
Assay in a microplate
Perform the assay in the wells according to the following table scheme.
| Test | Standard | Blank | |
|---|---|---|---|
| Chromogen reagent | 300 μL | 300 μL | 300 μL |
| Sample | Sample 2µL | Standard solution 2µL | - *1 |
| Mix well and incubate at 37 ℃ for 5 min. Measure the absorbance at 505 nm*2 of the test sample and standard solution with the blank solution as the control. |
|||
*1: The addition of water is omitted because the absorbance difference in the presence of the addition of 2 μL of water does not exhibit any practical use.
*2: Use 505 nm (Primary) and 600 nm (Reference) for two wavelengths.
Data
Repeatability (within run precision)
Repeatability was conducted by measuring sixfold assays of serum samples from human, mouse and rat at two concentrations with this product.
| n\ID | Human serum | Mouse serum | Rat serum | |||
|---|---|---|---|---|---|---|
| ID1 (mg/dL) | ID2 (mg/dL) | ID1 (mg/dL) | ID2 (mg/dL) | ID1 (mg/dL) | ID2 (mg/dL) | |
| 1 | 320 | 171 | 372 | 108 | 424 | 117 |
| 2 | 334 | 164 | 353 | 104 | 422 | 115 |
| 3 | 326 | 167 | 379 | 109 | 415 | 119 |
| 4 | 329 | 167 | 369 | 110 | 406 | 112 |
| 5 | 328 | 162 | 359 | 105 | 413 | 111 |
| 6 | 338 | 171 | 351 | 107 | 415 | 114 |
| mean | 329 | 167 | 364 | 107 | 416 | 115 |
| SD | 6.27 | 3.63 | 11.2 | 2.32 | 6.49 | 3.01 |
| CV(%) | 1.9 | 2.2 | 3.1 | 2.2 | 1.6 | 2.6 |
[Result]
The CV (%) of human serum was 1.9-2.2%, mouse serum was 2.2-3.1% and rat serum was 1.6-2.6%, indicating good repeatability.
Reproducibility (between run precision)
Reproducibility was conducted by measuring serum samples from human, mouse and rat at three concentrations each for four days with this product.
| Day\ID | Human serum | Mouse serum | Rat serum | ||||||
|---|---|---|---|---|---|---|---|---|---|
| ID3 (mg/dL) | ID4 (mg/dL) | ID5 (mg/dL) | ID3 (mg/dL) | ID4 (mg/dL) | ID5 (mg/dL) | ID3 (mg/dL) | ID4 (mg/dL) | ID5 (mg/dL) | |
| 1 | 361 | 172 | 88.3 | 364 | 180 | 99.1 | 410 | 198 | 104 |
| 2 | 385 | 181 | 90.4 | 376 | 190 | 101 | 414 | 209 | 105 |
| 3 | 364 | 178 | 89.0 | 386 | 189 | 104 | 419 | 203 | 105 |
| 4 | 389 | 183 | 92.4 | 392 | 196 | 106 | 430 | 212 | 108 |
| mean | 375 | 179 | 90.0 | 380 | 189 | 103 | 418 | 206 | 106 |
| SD | 14.3 | 4.80 | 1.81 | 12.3 | 6.60 | 3.07 | 8.66 | 6.24 | 1.73 |
| CV(%) | 3.8 | 2.7 | 2.0 | 3.2 | 3.5 | 3.0 | 2.1 | 3.0 | 1.6 |
[Result]
The CV (%) of human serum was 2.0-3.8%, mouse serum was 3.0-3.5% and rat serum was 1.6-3.0%, indicating good reproducibility.
Dilution Linearity Test
Serum from human, mouse and rat spiked with the standard, were serially diluted twofold with saline and measured in duplicate to assess linearity.
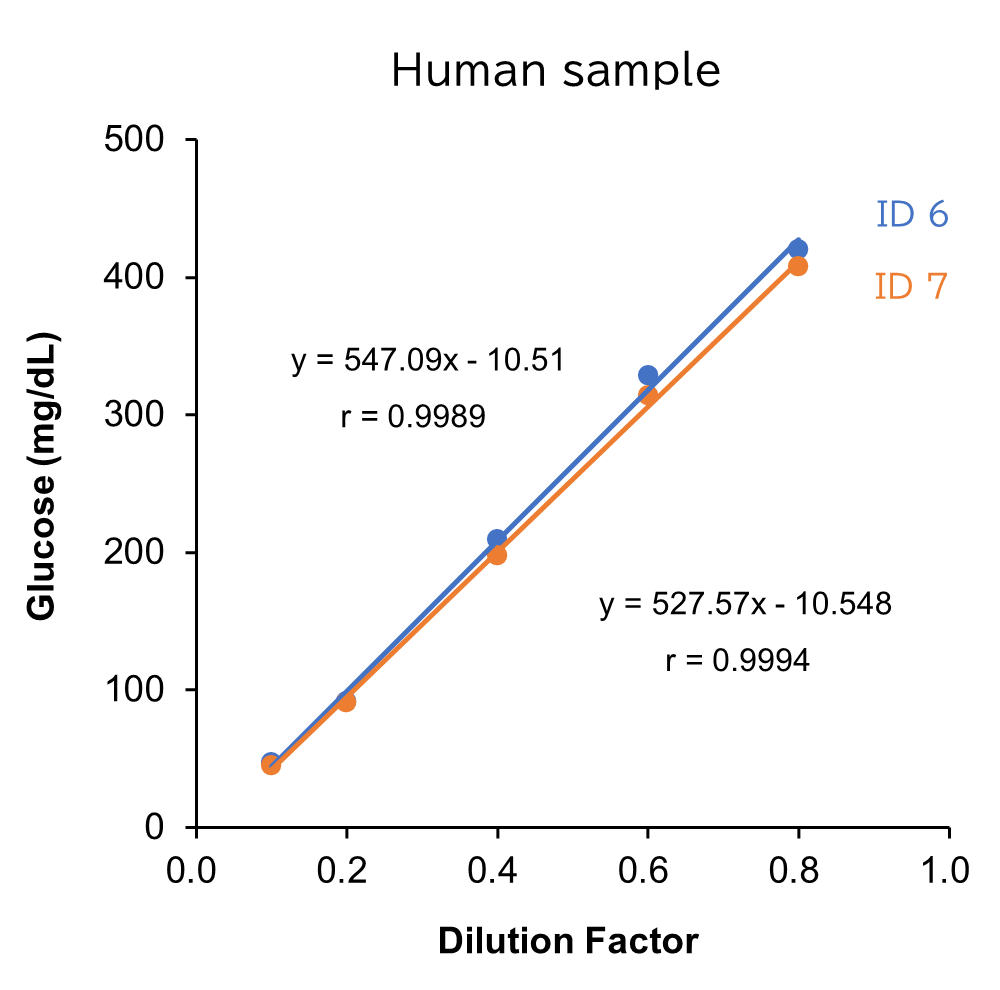
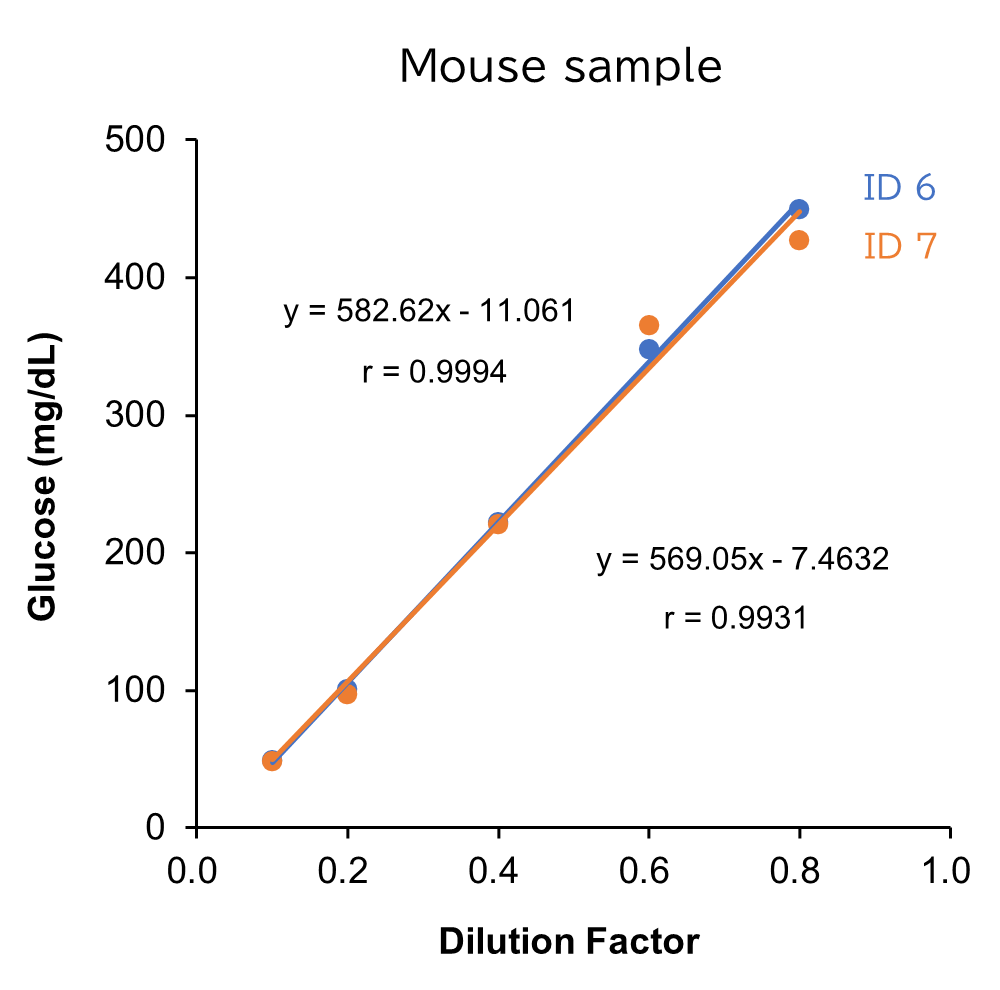
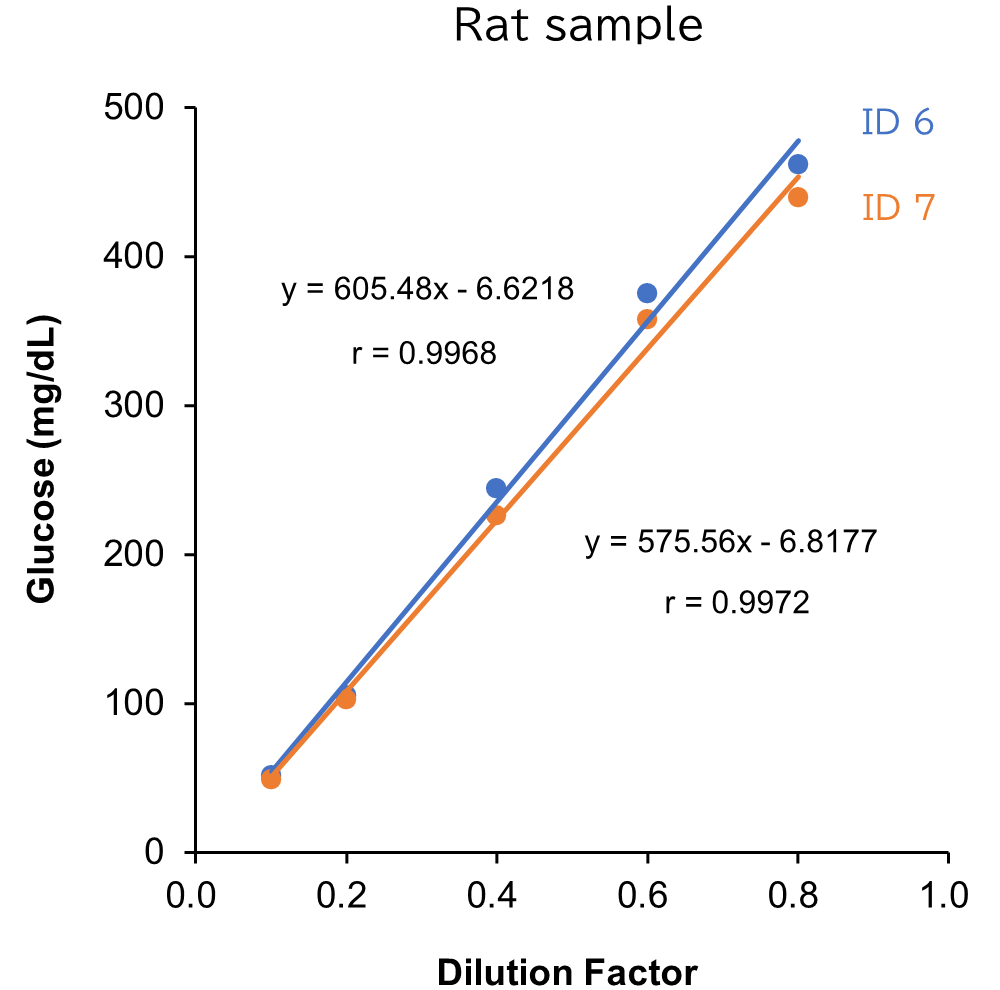
[Result]
All measurement results showed good linearity within the measurement range.
Spike and Recovery Test
Standard solutions at four concentrations were added to serum/plasma (EDTA, heparin) from human, mouse and rat. Next, spike recovery tests were conducted, with each measurement performed in duplicate.
Human sample
| Spiked amount (mg/dL) |
Measurement value (mg/dL) |
Recovery volume (mg/dL) |
Recovery rate (%) |
|
|---|---|---|---|---|
| Serum | - | 104 | - | - |
| 109 | 205 | 101 | 92.7 | |
| 163 | 246 | 143 | 87.7 | |
| 218 | 308 | 204 | 93.6 | |
| 272 | 363 | 259 | 95.2 | |
| Average | 92.3 | |||
| Plasma (EDTA) |
- | 100 | - | - |
| 114 | 201 | 101 | 88.6 | |
| 171 | 249 | 149 | 87.1 | |
| 228 | 306 | 206 | 90.4 | |
| 285 | 357 | 257 | 90.2 | |
| Average | 89.1 | |||
| Plasma (heparin) |
- | 103 | - | |
| 112 | 219 | 116 | 104 | |
| 168 | 262 | 159 | 94.6 | |
| 224 | 308 | 205 | 91.5 | |
| 280 | 369 | 266 | 95.0 | |
| Average | 96.2 | |||
Mouse sample
| Spiked amount (mg/dL) |
Measurement value (mg/dL) |
Recovery volume (mg/dL) |
Recovery rate (%) |
|
|---|---|---|---|---|
| Serum | - | 98.1 | - | - |
| 89.2 | 177 | 78.9 | 98.3 | |
| 134 | 201 | 103 | 90.6 | |
| 178 | 251 | 153 | 88.8 | |
| 223 | 280 | 182 | 93.8 | |
| Average | 92.9 | |||
| Plasma (EDTA) |
- | 93 | - | - |
| 90.8 | 174 | 81.0 | 95.9 | |
| 136 | 203 | 110 | 97.5 | |
| 182 | 248 | 155 | 98.0 | |
| 227 | 276 | 183 | 97.4 | |
| Average | 97.2 | |||
| Plasma (heparin) |
- | 111 | - | |
| 91.2 | 187 | 76.0 | 83.3 | |
| 137 | 227 | 116 | 84.7 | |
| 182 | 263 | 152 | 83.5 | |
| 228 | 294 | 183 | 80.3 | |
| Average | 82.9 | |||
Rat sample
| Spiked amount (mg/dL) |
Measurement value (mg/dL) |
Recovery volume (mg/dL) |
Recovery rate (%) |
|
|---|---|---|---|---|
| Serum | - | 96.1 | - | - |
| 86.1 | 179 | 82.5 | 95.8 | |
| 129 | 214 | 117 | 90.7 | |
| 172 | 258 | 162 | 94.2 | |
| 215 | 295 | 199 | 92.6 | |
| Average | 93.3 | |||
| Plasma (EDTA) |
- | 101 | - | - |
| 95.0 | 193 | 92.0 | 96.8 | |
| 143 | 226 | 125 | 87.4 | |
| 190 | 273 | 172 | 90.5 | |
| 238 | 310 | 209 | 87.8 | |
| Average | 90.6 | |||
| Plasma (heparin) |
- | 103 | - | |
| 99.0 | 196 | 93.0 | 93.9 | |
| 149 | 226 | 123 | 82.6 | |
| 198 | 279 | 176 | 88.9 | |
| 248 | 319 | 216 | 87.1 | |
| Average | 88.1 | |||
[Result]
Good recovery rates were confirmed.
Measurement Using Actual Samples
Human sample
| ID\n | Measurement value (mg/dL) |
mean | SD | CV (%) |
||
|---|---|---|---|---|---|---|
| 1 | 2 | |||||
| Serum | ID1 | 104 | 103 | 104 | 0.707 | 0.7 |
| Plasma (EDTA) | ID1 | 100 | 100 | 100 | 0.00 | 0.0 |
Rat sample (S.D. rat)
| ID\n | Measurement value (mg/dL) |
mean | SD | CV (%) |
||
|---|---|---|---|---|---|---|
| 1 | 2 | |||||
| Serum | ID1 | 132 | 140 | 136 | 5.66 | 4.2 |
| ID2 | 114 | 122 | 118 | 5.66 | 4.8 | |
| ID3 | 135 | 144 | 140 | 6.36 | 4.6 | |
| ID4 | 118 | 115 | 117 | 2.12 | 1.8 | |
| ID5 | 132 | 137 | 135 | 3.54 | 2.6 | |
| Plasma (EDTA) |
ID1 | 107 | 108 | 108 | 0.707 | 0.7 |
| ID2 | 109 | 112 | 111 | 2.12 | 1.9 | |
| ID3 | 124 | 123 | 124 | 0.707 | 0.6 | |
| ID4 | 105 | 111 | 108 | 4.24 | 3.9 | |
| ID5 | 110 | 118 | 114 | 5.66 | 5.0 | |
Mouse sample (CD-1(ICR))
| ID\n | Measurement value (mg/dL) |
mean | SD | CV (%) |
||
|---|---|---|---|---|---|---|
| 1 | 2 | |||||
| Serum | ID1 | 127 | 133 | 130 | 4.24 | 3.3 |
| ID2 | 146 | 148 | 147 | 1.41 | 1.0 | |
| ID3 | 143 | 158 | 151 | 10.6 | 7.0 | |
| ID4 | 150 | 157 | 154 | 4.95 | 3.2 | |
| ID5 | 136 | 132 | 134 | 2.83 | 2.1 | |
| Plasma (EDTA) |
ID1 | 86.8 | 87.9 | 87.4 | 0.778 | 0.9 |
| ID2 | 88.3 | 94.4 | 91.4 | 4.31 | 4.7 | |
| ID3 | 100 | 95.1 | 97.6 | 3.46 | 3.6 | |
| ID4 | 108 | 98.8 | 103 | 6.51 | 6.3 | |
| ID5 | 106 | 109 | 108 | 2.12 | 2.0 | |
| Whole blood | ID1 | 81.6 | 82.9 | 82.3 | 0.919 | 1.1 |
| ID2 | 108 | 118 | 113 | 7.07 | 6.3 | |
| ID3 | 92.0 | 84.5 | 88.3 | 5.30 | 6.0 | |
| ID4 | 95.5 | 101 | 98.3 | 3.89 | 4.0 | |
| ID5 | 69.3 | 67.2 | 68.3 | 1.48 | 2.2 | |
Dog sample (Beagle)
| ID\n | Measurement value (mg/dL) |
mean | SD | CV (%) |
||
|---|---|---|---|---|---|---|
| 1 | 2 | |||||
| Serum | ID1 | 97.6 | 110 | 104 | 8.77 | 8.4 |
| ID2 | 71.1 | 79.7 | 75.4 | 6.08 | 8.1 | |
| ID3 | 65.2 | 75.0 | 70.1 | 6.93 | 9.9 | |
| ID4 | 63.3 | 62.7 | 63.0 | 0.424 | 0.7 | |
| ID5 | 77.6 | 86.5 | 82.1 | 6.29 | 7.7 | |
| ID6 | 73.3 | 79.0 | 76.2 | 4.03 | 5.3 | |
| ID7 | 36.8 | 38.8 | 37.8 | 1.41 | 3.7 | |
| ID8 | 56.2 | 60.2 | 58.2 | 2.83 | 4.9 | |
| Plasma (EDTA) |
ID1 | 97.4 | 89.3 | 93.4 | 5.73 | 6.1 |
| ID2 | 96.0 | 90.9 | 93.5 | 3.61 | 3.9 | |
| ID3 | 88.5 | 81.4 | 85.0 | 5.02 | 5.9 | |
| ID4 | 78.6 | 71.8 | 75.2 | 4.81 | 6.4 | |
| ID5 | 85.5 | 80.2 | 82.9 | 3.75 | 4.5 | |
| ID6 | 75.0 | 71.8 | 73.4 | 2.26 | 3.1 | |
| ID7 | 85.7 | 83.7 | 84.7 | 1.41 | 1.7 | |
| ID8 | 83.9 | 82.6 | 83.3 | 0.919 | 1.1 | |
Cat sample (Short hair)
| ID\n | Measurement value (mg/dL) |
mean | SD | CV (%) |
||
|---|---|---|---|---|---|---|
| 1 | 2 | |||||
| Serum | ID1 | 63.2 | 64.7 | 64.0 | 1.06 | 1.7 |
| ID2 | 65.2 | 67.1 | 66.2 | 1.34 | 2.0 | |
| ID3 | 32.4 | 37.0 | 34.7 | 3.25 | 9.4 | |
| ID4 | 40.2 | 43.3 | 41.8 | 2.19 | 5.3 | |
| ID5 | 44.8 | 44.2 | 44.5 | 0.424 | 1.0 | |
| ID6 | 21.4 | 20.3 | 20.9 | 0.778 | 3.7 | |
| ID7 | 253 | 248 | 251 | 3.54 | 1.4 | |
| ID8 | 98.2 | 91.6 | 94.9 | 4.67 | 4.9 | |
| Plasma (EDTA) |
ID1 | 200 | 201 | 201 | 0.707 | 0.4 |
| ID2 | 118 | 115 | 117 | 2.12 | 1.8 | |
| ID3 | 223 | 224 | 224 | 0.707 | 0.3 | |
| ID4 | 272 | 261 | 267 | 7.78 | 2.9 | |
| ID5 | 120 | 119 | 120 | 0.707 | 0.6 | |
| ID6 | 115 | 112 | 114 | 2.12 | 1.9 | |
| ID7 | 134 | 136 | 135 | 1.41 | 1.0 | |
| ID8 | 107 | 109 | 108 | 1.41 | 1.3 | |
FAQ
About sample
- Is there any influence from substances that interfere with measurement (ascorbic acid, bilirubin, etc.)?
- Ascorbic acid and bilirubin produce a slight negative bias, while hemolysis causes a slight positive bias. However, the anticoagulants heparin, citrate, oxalate, and EDTA, as well as the glycolysis inhibitor sodium fluoride, do not affect the measured values when used at standard concentrations.
About kit usage
- What instruments, and equipment are required for the assay using this kit?
- The instruments and equipment required for the use of this kit are listed below.
- 96 well microplate (transparent type)
- Micropipette
- Plate mixer*
- Incubator maintaining at 37°C*
- Microplate reader with 505 nm wavelength filter
(*This is not necessary depending on the model of the microplate reader.)
(For Test Tube method)
- Test tube
- Pipette
- Incubator maintaining at 37°C
- Spectrophotometer or colorimeter with a 505 nm wavelength filter
- What are the storage conditions and shelf-life guidelines for each reagent?
- Chromogen Reagent :
Dissolve 1 bottle of Chromogen Substrate with 150 mL of Buffer Solution. After reconstitution, the solution should be stored at 2°C - 10°C and used within 1 month.
Overview / Applications
Property
Manufacturer Information
Alias
- 638-50971 (Previous Code)
LABGLUC-M1 (Previous Code)
298-65701 (Previous Code)
LabAssay
For research use or further manufacturing use only. Not for use in diagnostic procedures.
Product content may differ from the actual image due to minor specification changes etc.
If the revision of product standards and packaging standards has been made, there is a case where the actual product specifications and images are different.
The prices are list prices in Japan.Please contact your local distributor for your retail price in your region.