Glucose Assay Kits
Measuring the blood glucose level is important for understanding the status of energy metabolism and blood sugar homeostasis in the body. The mutarotase-GOD method, in which mutarotase is added to glucose oxidase, has several features and benefits: it is a colorimetric assay, has a short turnaround time, and is capable of measuring small amounts of D-glucose, making it an excellent method for measuring the blood glucose level.
LabAssay™ Glucose uses the mutarotase-GOD method to measure glucose in samples. With the use of a microplate, this kit provides a quick and convenient method for measuring glucose in samples.
What is Glucose?
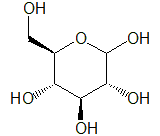
Glucose, also known as grape sugar, is a monosaccharide that is widely found in nature, including in plant tissues such as fruits and in animal body fluids. It is also a component of oligosaccharides (such as sucrose and lactose) and polysaccharides (such as starch, cellulose, and glycogen). While there is the optical isomer, L-glucose, the form found in nature is mainly D-glucose.
Glucose is an essential energy source for living organisms. The glucose obtained from the breakdown of food is carried by the blood to cells throughout the body. Once taken up by cells, glucose is gradually oxidized by enzymes, and energy is extracted. In glycolysis, which does not require oxygen, glucose is broken down to pyruvic acid, and energy is produced in the process. In the presence of oxygen, the pyruvic acid produced from glucose is converted to acetyl CoA, and through the citric acid cycle and the electron transport chain, even more energy is produced. Organisms also have ways of storing glucose as a source of energy that can be mobilized during times of food deprivation. In animals, glucose is stored as glycogen, which is a chain of glucose molecules. Glycogen is primarily stored as granules in the liver and muscles and is broken down when energy is needed.
Blood sugar levels (the amount of glucose in the blood) are regulated by various hormones and are maintained at a constant level. Insulin promotes the uptake of glucose by cells and has the effect of lowering blood sugar levels. Dysfunction of insulin secretion can lead to chronic hyperglycemia, which is a cause of diabetes. Conversely, glucagon promotes the breakdown of glycogen into glucose, raising blood sugar levels1). In biochemical tests, the glucose (GLU) in the blood is measured to screen for abnormalities in the regulation of blood sugar.
Methods of Glucose Measurement
Measuring blood glucose is important in order to understand the status of energy metabolism and blood sugar homeostasis in the body. For the measurement of D-glucose, there are non-enzymatic methods using polarimeters, nuclear magnetic resonance (NMR) devices, and gas chromatography, as well as enzymatic methods using glucose oxidase (GOD). Among the enzymatic methods, the mutarotase-GOD method, in which mutarotase is added to glucose oxidase, has several features and benefits: it is a colorimetric assay, has a short turnaround time, and is capable of measuring even smaller amounts of glucose compared to using glucose oxidase alone2). This makes it an excellent method for the measurement of blood glucose.
Principle of the glucose assay using the mutarotase-GOD method
In living organisms, there are two forms of D-glucose: α-D-glucose and β-D-glucose. While a linear structure (aldehyde form) of glucose also exists, the levels are minute. For the quantification of glucose, β-D-glucose oxidase is used. This enzyme specifically oxidizes β-D-glucose, producing hydrogen peroxide (H2O2) and gluconic acid. Mutarotase is used to promote the conversion of α-D-glucose to β-D-glucose.
The assay principle of the mutarotase-GOD method is shown in Figure 1. Mutarotase converts α-D-glucose to β-D-glucose. Then, hydrogen peroxide is produced in the reaction between β-D-glucose and glucose oxidase. The hydrogen peroxide and peroxidase in the chromogenic agent cause the oxidative condensation of phenol and 4-aminoantipyrine. The glucose in the sample is determined using the absorbance of the resulting red dye as an indicator.
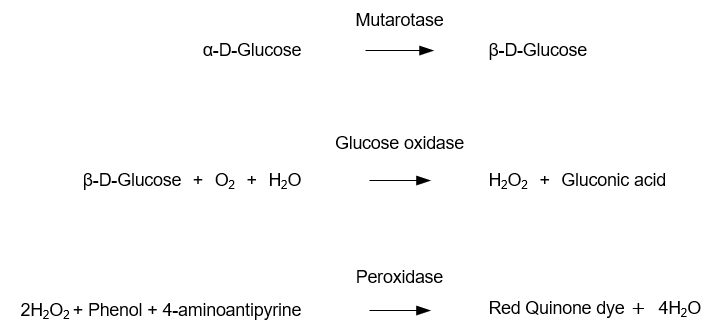
Figure 1. Principle of the glucose assay using the mutarotase-GOD method
LabAssay™ Glucose
LabAssay™ Glucose is a kit used for the determination of glucose in sample using the mutarotase-GOD method. With the use of a microplate, this kit provides a quick and convenient method for measuring glucose in samples.
Kit Performance
| Analysis sample* | Human Serum/Plasma Mouse Serum/Plasma Rat Serum/Plasma Dog Serum/Plasma Cat Serum/Plasma |
|---|---|
| Calibration curve range | 50-500 mg/dL |
| Sample volume | 2 μL |
| Measurement duration | Approx. 10 min |
| Wavelength | Primary wavelength 505 nm Reference wavelength 600 nm |
* Measurement in animal cell culture supernatants3-4) and E. coli culture media5) has been also reported.
Educational Training Using LabAssay™ Glucose
LabAssay™ Glucose comes with all the necessary reagents and samples for glucose measurement, and can be readily used as a training kit. Students can acquire measurement skills and deepen their knowledge of the assay principle and related subjects through the measurement of control samples.
Why it is ideal for educational training
- Measurement can be completed in a short time (about 10 minutes).
- Samples can be prepared just by dissolving and mixing.
- The kit capacity is 500 assays, making it possible to conduct measurements with a large number of participants.
What can be learned with this kit
[For Beginners]
- Assay principles and procedures for glucose measurement
- Mastery of basic reagent preparation
- Handling of pipettors
- Handling of 96-well plates
- Handling of microplate readers
- Creating graphs and data analysis
[For Experienced Users]
- Continuous evaluation of operator skills and measurement environment
- Opportunities for identifying and improving issues related to operators and the measurement environment
(inappropriate measurement practices and procedures, and inadequate calibration of equipment) - Understanding the variations among operators and the measurement environment
- Ensuring the reliability of measurement data
- Opportunities for education and training
Kit Operation Procedures (for Educational Training)
Reagent Preparation
Sample Preparation
Measurement Operation
Measurement
Sample Preparation (for Calibration Curve Creation)
Mix the standard solution and purified water according to the table below to prepare samples.
| Sample No. | For sample preparation | For measurement | |||
|---|---|---|---|---|---|
| Standard solution I | Standard solution II | Purified Water | Amount of use | Concentration | |
| 1 | 50 μL | - | 150 μL | 2 μL | 50 mg/dL |
| 2 | 100 μL | - | 100 μL | 2 μL | 100 mg/dL |
| 3 | Undiluted | - | - | 2 μL | 200 mg/dL |
| 4 | - | 150 μL | 100 μL | 2 μL | 300 mg/dL |
| 5 | - | 200 μL | 50 μL | 2 μL | 400 mg/dL |
| 6 | - | Undiluted | - | 2 μL | 500 mg/dL |
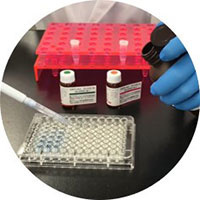
Measurement
- Add each sample to the microplate according to Table 2 (2 wells for each).
- Add 300 μL of the chromogenic reagent to the wells containing the samples.
- Mix well using a shaker and allow it to stand at 37℃ for 15 minutes. Note that there should be almost no change in color within 1 hour at room temperature.
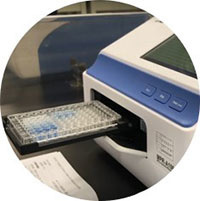
- Using a microplate reader, measure the absorbance with the blank as a control (primary wavelength 505 nm / reference wavelength 600 nm).
| Name | Sample | Purified water | Chromogenic reagent |
|---|---|---|---|
| Unknown sample X | 2 μL | - | 300 μL each |
| Unknown sample Y | 2 μL | - | |
| Sample 1 | 2 μL | - | |
| Sample 2 | 2 μL | - | |
| Sample 3 | 2 μL | - | |
| Sample 4 | 2 μL | - | |
| Sample 5 | 2 μL | - | |
| Sample 6 | 2 μL | - | |
| Blank | - | 2 μL |
Data analysis
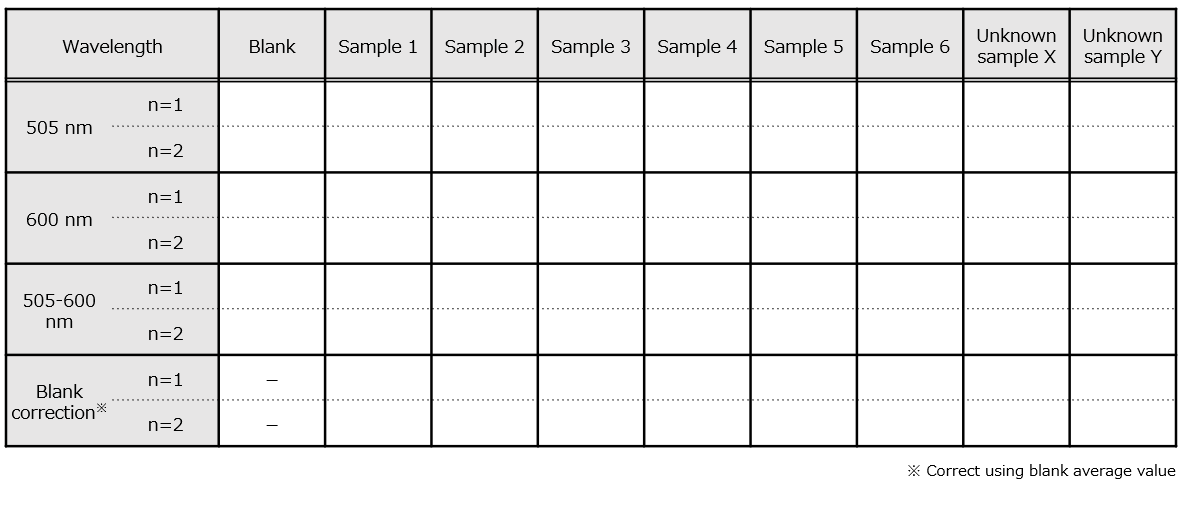
Example of Data Recording Sheet
Record the measurement results (absorbance) on the sheet below.
Correct the data using the average value of the blank (in the case of n=2).
Example of data analysis
1. Based on the absorbance of the blank and samples 1-6, create a calibration curve as shown in Figure 1.
2. Calculate the glucose concentration of unknown samples X and Y based on the regression equation of the calibration curve.
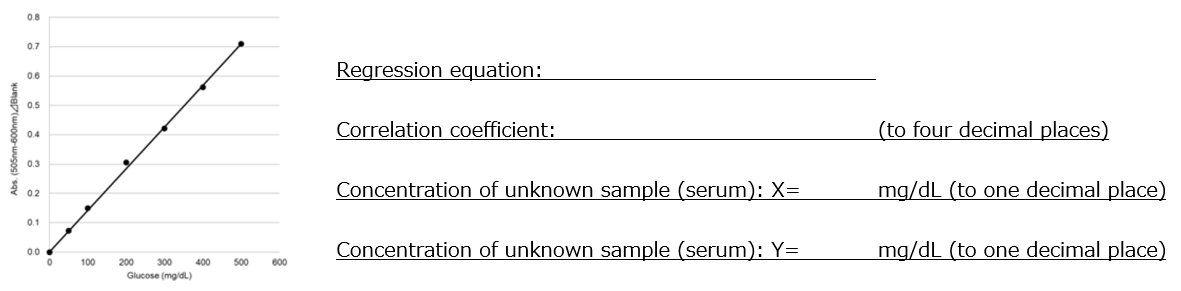
Figure 1. Calibration curve
References
- Jiang, G. and Zhang, B. B.: Am. J. Physiol. Endocrinol. Metab., 284(4), E671(2003).
Glucagon and regulation of glucose metabolism. - Okuda, J., Miwa, I. and Maeda, K.: Japanese Journal of Clinical Chemistry, 2(3), 289(1973).
Microdetermination of α-, β-anomers of D-glucose (Japanese) - Munakata, Y. et al.: J. Reprod. Dev., 65(2), 171(2019).
Cell-free DNA in medium is associated with the maturation ability of in vitro cultured oocytes - Sasaki, S. et al.: Mol. Cell. Biol., 38(24), e00213(2018).
Induction of hepatic metabolic functions by a novel variant of hepatocyte nuclear factor 4γ - Xu, P. et al.: Metab Eng., 13(5), 578(2011).
Genome-scale metabolic network modeling results in minimal interventions that cooperatively force carbon flux towards malonyl-CoA
Product List
- Open All
- Close All
LabAssay™ Glucose
For research use or further manufacturing use only. Not for use in diagnostic procedures.
Product content may differ from the actual image due to minor specification changes etc.
If the revision of product standards and packaging standards has been made, there is a case where the actual product specifications and images are different.
The prices are list prices in Japan.Please contact your local distributor for your retail price in your region.