LabAssay™ Cholesterol
- for Cellbiology
- Manufacturer :
- FUJIFILM Wako Pure Chemical Corporation
- Storage Condition :
- Keep at 2-10 degrees C.
- GHS :
-


-
 Close
Close
- Structural Formula
- Label
- Packing
- SDS
|
Comparison
|
Product Number
|
Package Size
|
Price
|
Inventory
|
|
|---|---|---|---|---|---|
|
|
|
500Tests
|
|
In stock in Japan |
Please check here for notes on products and prices.
Document
Kit component
For 500 tests
| Buffer Solution | 150 mL x 1 bottle |
|---|---|
| Chromogen Substrate | for 150 mL x 1 bottle |
| Standard Solution | 5 mL x 1 bottle |
Product Overview
Cholesterol concentration in serum is known to be closely related with production, absorption and dissimilation in liver and intestinal tract, and lipoprotein metabolism in blood.
LabAssay™ Cholesterol is a kit designed to measure total cholesterol in samples by an enzyme reaction using N-Ethyl-N-(2-hydroxy-3-sulfopropyl)-3,5-dimethoxyaniline sodium salt (DAOS).
Kit Performance
| Analysis sample | Human Serum/Plasma Mouse Serum/Plasma Rat Serum/Plasma Dog Serum/Plasma Cat Serum/Plasma Culture medium (D-MEM)* |
|---|---|
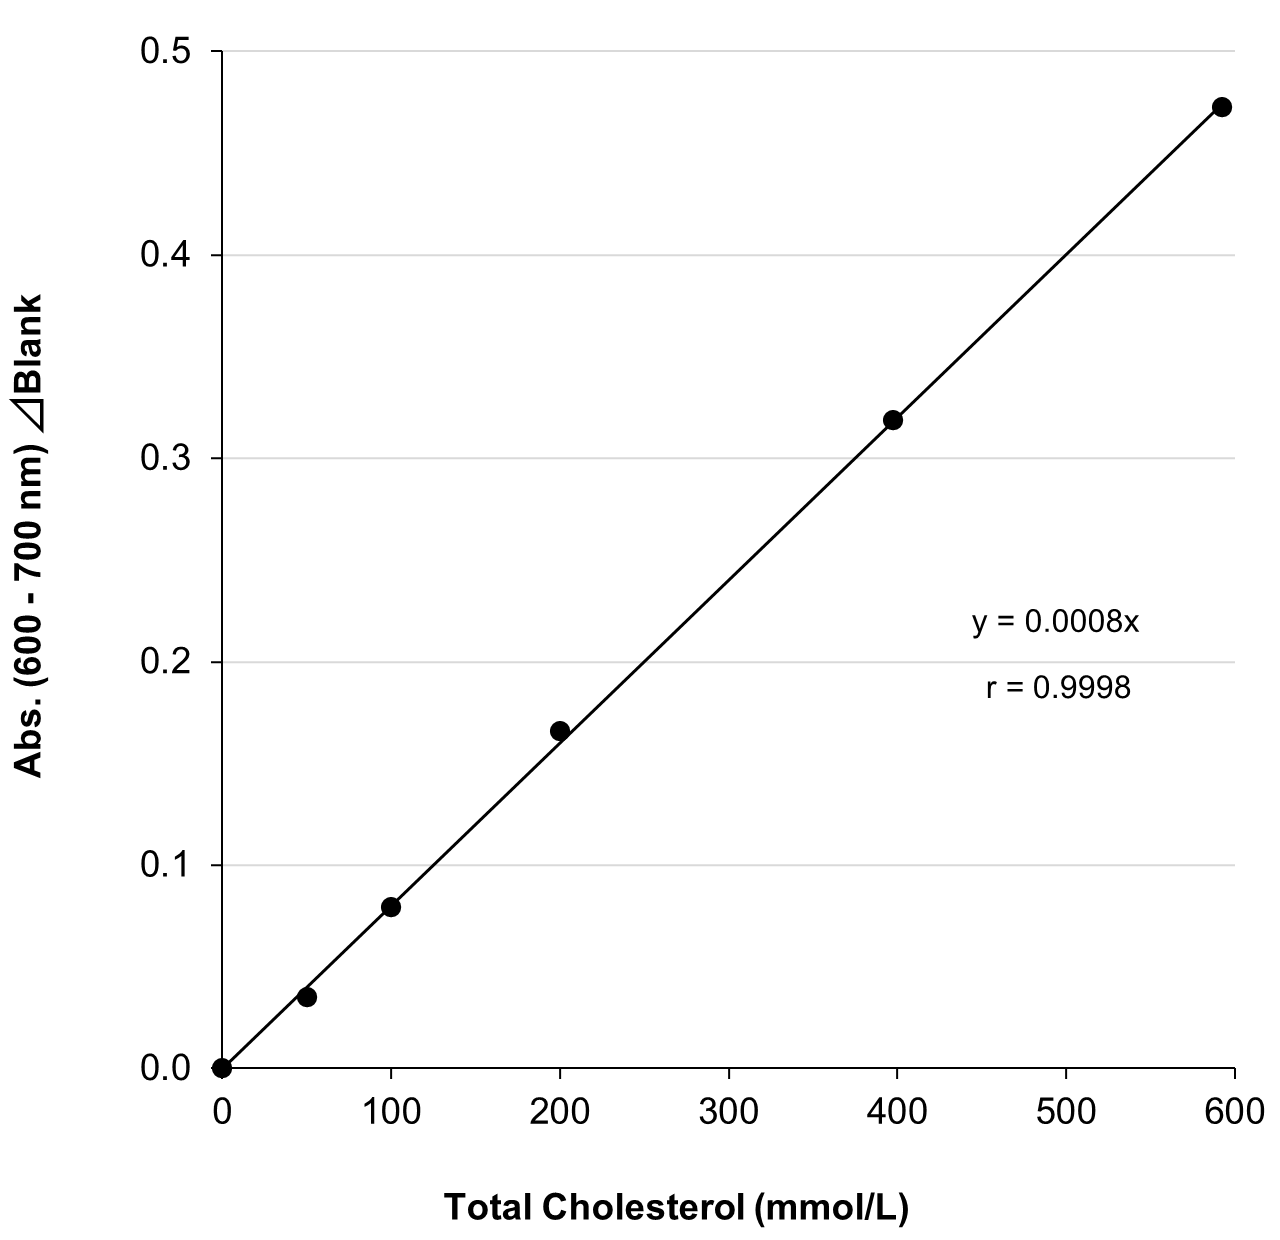
| Calibration curve range | 50 - 592.2 mg/dL |
| Sample volume | 2 μL |
| Measurement duration | Approx. 10 min |
| Wavelength | Primary wavelength 600 nm Reference wavelength 700 nm |
Measurement availability depends on the culture medium, cell type and culture conditions. Please perform a spiked recovery test or dilution linearity test in advance using the culture medium to be used in your experiment.
Example of Calibration Curve
Assay principle
Cholesterol esters in the sample are decomposed into free cholesterol and fatty acid by cholesterol esterase, when the sample reacts with chromogen reagent. The cholesterol is oxidized with existing free cholesterol by cholesterol oxidase, and simultaneously hydrogen peroxide is produced. The produced hydrogen peroxide let DAOS and 4-Aminoantipyrin oxidize and condensate quantitatively by peroxidase (HRP), which produces a blue pigment. Quantitation of total cholesterol in the sample can be made by measurement of the absorbance.

Procedure
Assay in a microplate
Perform the assay in the wells according to the following table scheme.
| Test | Standard | Blank | |
|---|---|---|---|
| Chromogen reagent | 300 μL | 300 μL | 300 μL |
| Sample | 2 μL | 2 μL | - |
| Mix well and incubate at 37 ℃ for 5 min. Measure the absorbance of the test sample and standard solution with the blank solution as the control. Primary wavelength 600 nm / Referrence wavelength 700 nm. | |||
Data
Repeatability (within run precision)
Repeatability was conducted by measuring sixfold assays of serum samples from human, mouse and rat at two concentrations with this product.
| n\ID | Human serum | Mouse serum | Rat serum | |||
|---|---|---|---|---|---|---|
| ID1 (mg/dL) | ID2 (mg/dL) | ID1 (mg/dL) | ID2 (mg/dL) | ID1 (mg/dL) | ID2 (mg/dL) | |
| 1 | 169.8 | 81.3 | 146.3 | 97.3 | 134.9 | 78.9 |
| 2 | 172.8 | 86.6 | 143.1 | 95.9 | 135.0 | 75.3 |
| 3 | 176.3 | 90.5 | 139.5 | 92.4 | 140.1 | 74.6 |
| 4 | 183.8 | 86.8 | 138.8 | 85.8 | 132.3 | 70.0 |
| 5 | 178.2 | 84.1 | 137.4 | 90.3 | 130.9 | 76.7 |
| 6 | 174.6 | 88.1 | 139.8 | 86.6 | 133.7 | 77.7 |
| mean | 175.9 | 86.2 | 140.8 | 91.4 | 134.5 | 75.5 |
| SD | 4.824 | 3.19 | 3.280 | 4.73 | 3.169 | 3.13 |
| CV(%) | 2.7 | 3.7 | 2.3 | 5.2 | 2.4 | 4.1 |
[Result]
The CV (%) of human serum was 2.7-3.7%, mouse serum was 2.3-5.2% and rat serum was 2.4-4.1%, indicating good repeatability.
Reproducibility (between run precision)
Reproducibility was conducted by measuring serum samples from human, mouse and rat at three concentrations each for four days with this product.
| Day\ID | Human serum | Mouse serum | Rat serum | ||||||
|---|---|---|---|---|---|---|---|---|---|
| ID3 (mg/dL) | ID4 (mg/dL) | ID5 (mg/dL) | ID3 (mg/dL) | ID4 (mg/dL) | ID5 (mg/dL) | ID3 (mg/dL) | ID4 (mg/dL) | ID5 (mg/dL) | |
| 1 | 371.1 | 173.8 | 79.8 | 287.6 | 139.7 | 89.1 | 272.4 | 135.5 | 71.0 |
| 2 | 390.5 | 181.0 | 81.4 | 298.3 | 141.4 | 95.7 | 284.5 | 145.7 | 77.0 |
| 3 | 380.4 | 176.9 | 79.0 | 284.5 | 139.4 | 88.6 | 274.2 | 136.3 | 74.7 |
| 4 | 385.8 | 180.2 | 85.2 | 293.6 | 142.0 | 90.1 | 277.0 | 135.9 | 79.5 |
| mean | 382.0 | 178.0 | 81.4 | 291.0 | 140.6 | 90.9 | 277.0 | 138.4 | 75.6 |
| SD | 7.212 | 2.859 | 2.38 | 5.335 | 1.101 | 2.84 | 4.616 | 4.253 | 3.13 |
| CV(%) | 1.9 | 1.6 | 2.9 | 1.8 | 0.8 | 3.1 | 1.7 | 3.1 | 4.1 |
[Result]
The CV (%) of human serum was 1.6-2.9%, mouse serum was 0.8-3.1% and rat serum was 1.7-4.1%, indicating good reproducibility.
Dilution Linearity Test
Serum and plasma (EDTA) from human, mouse and rat, as well as D-MEM containing 10% FBS spiked with the standard, were serially diluted twofold with saline and measured in duplicate to assess linearity.
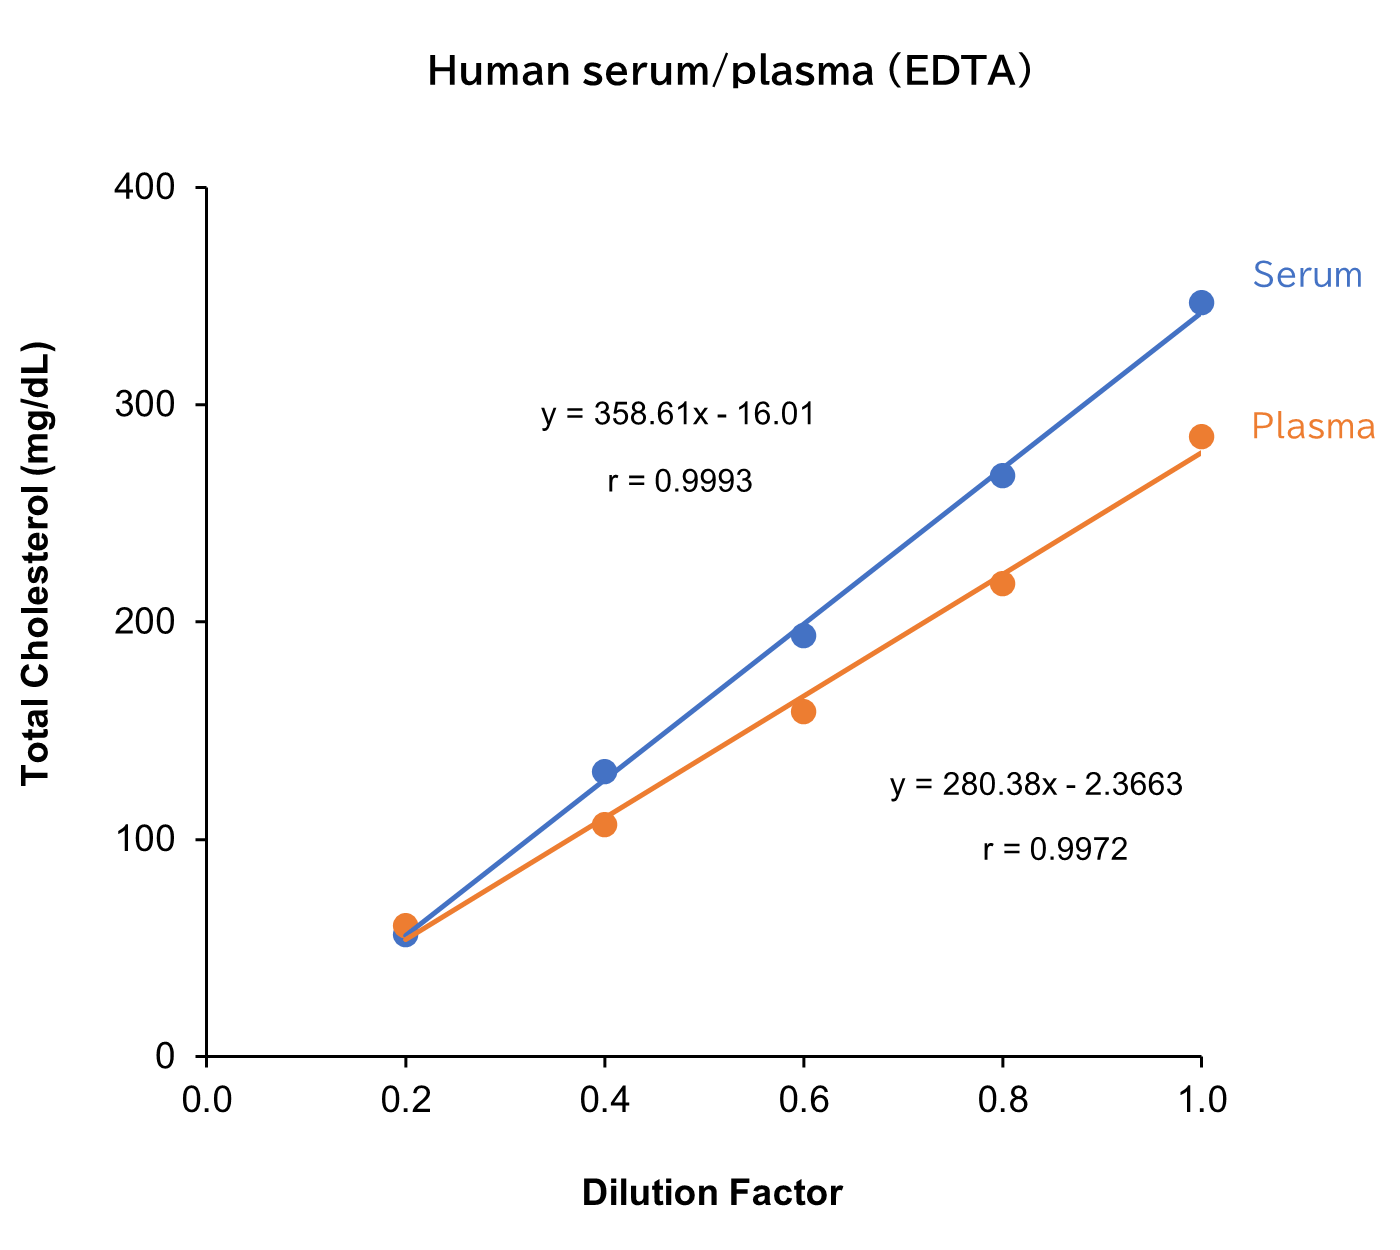
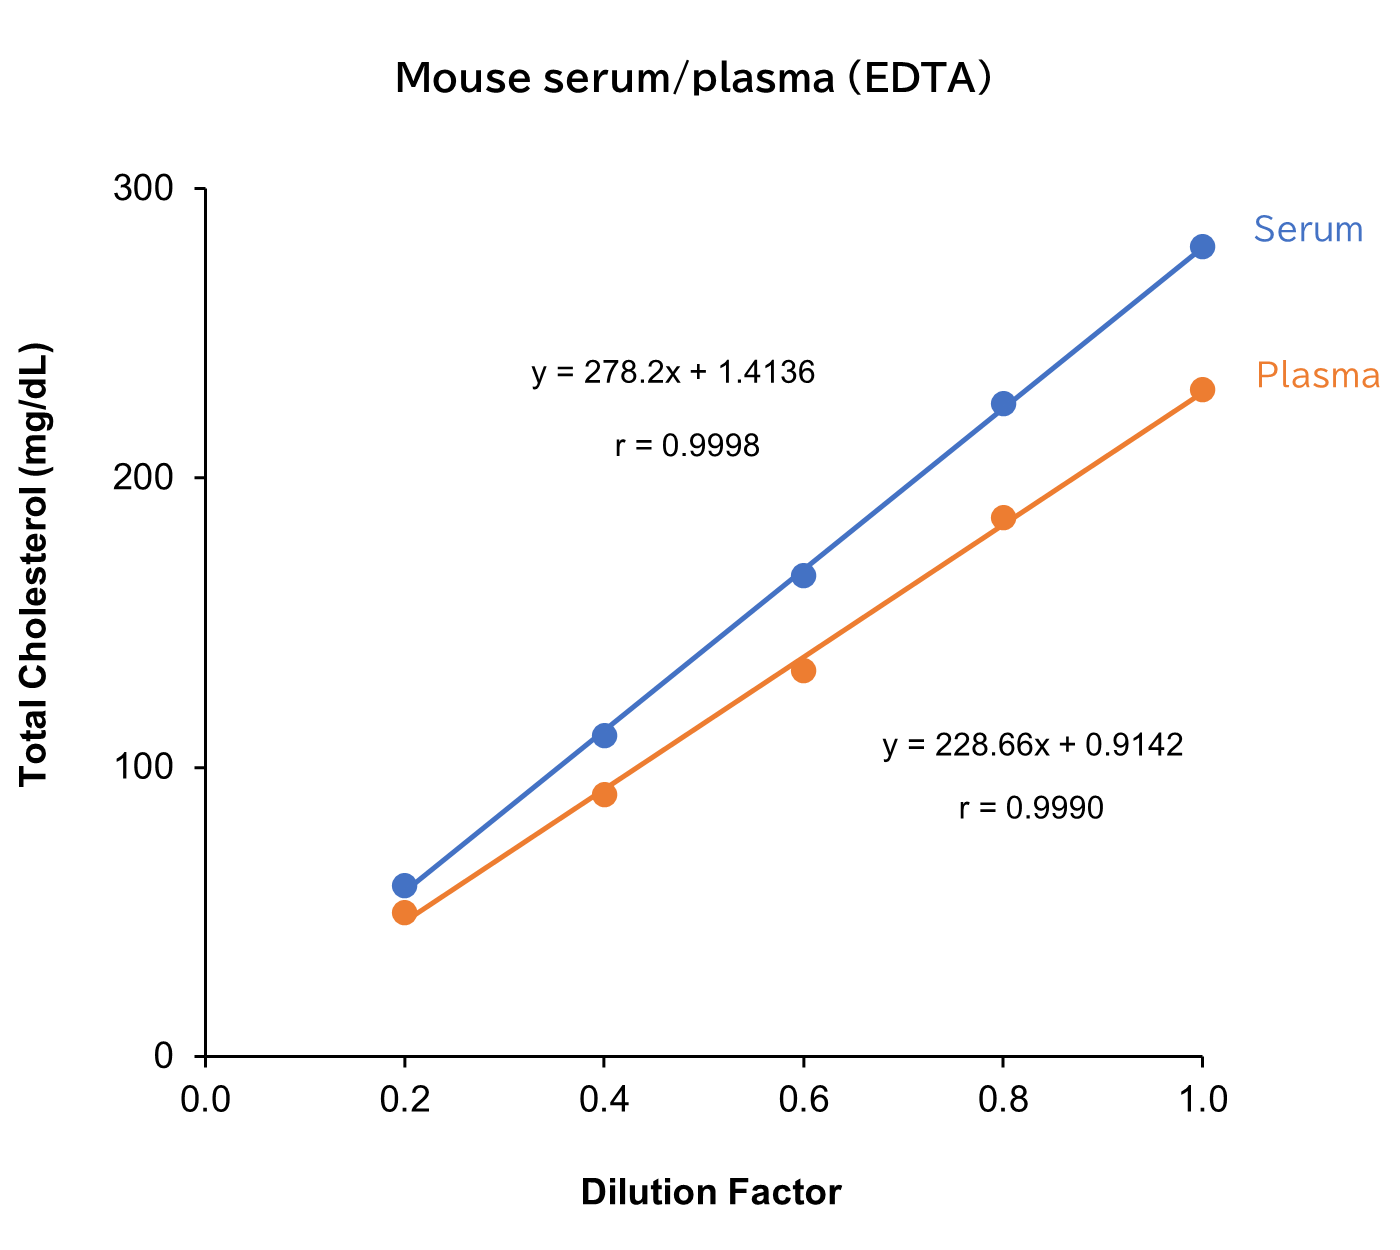
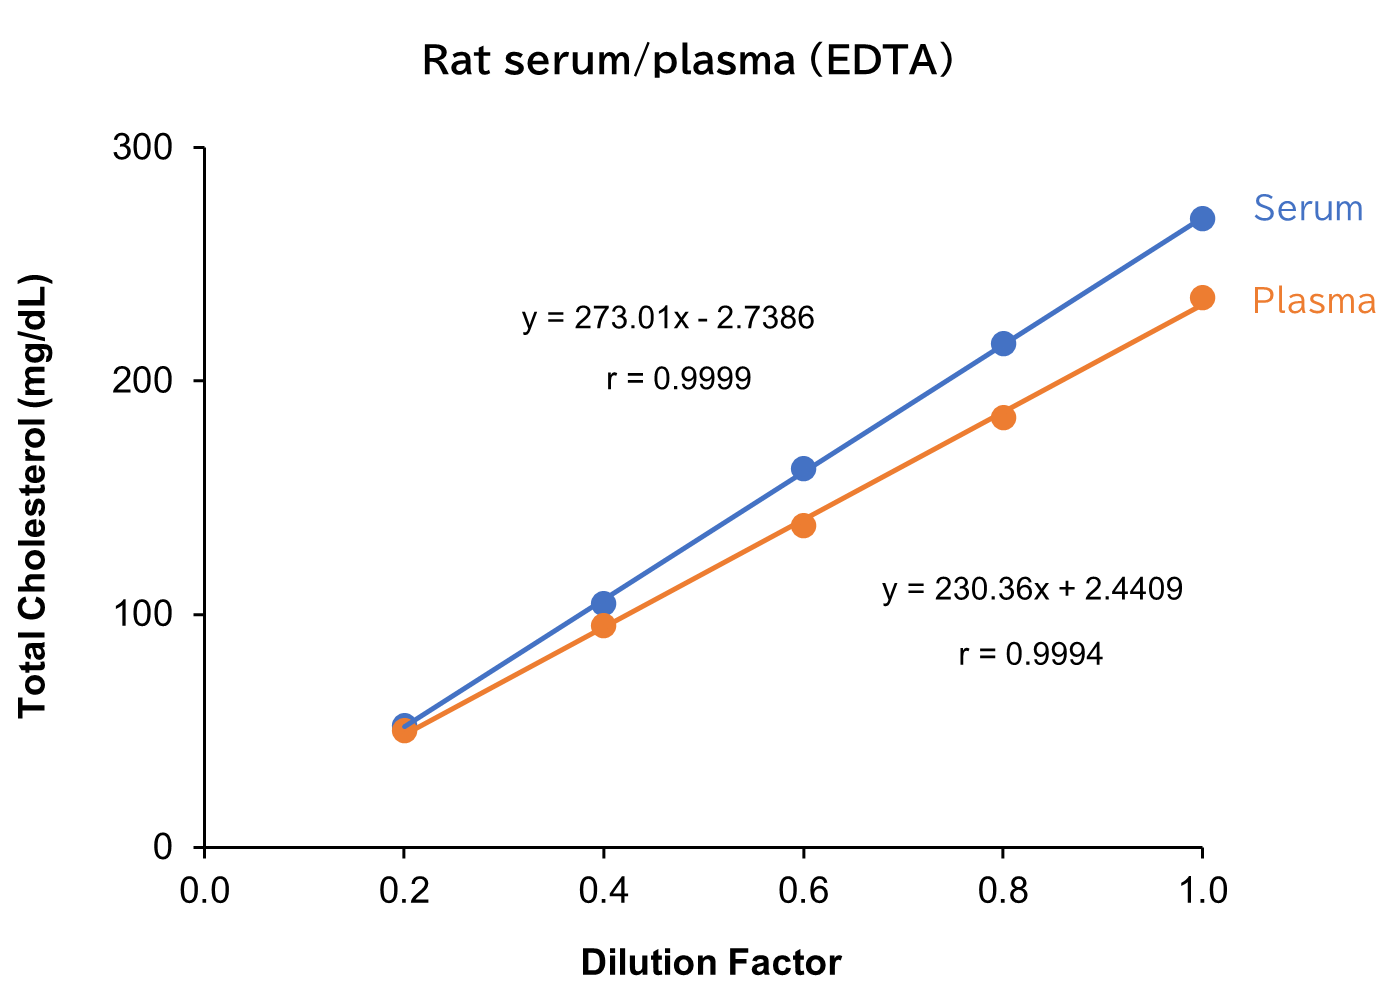
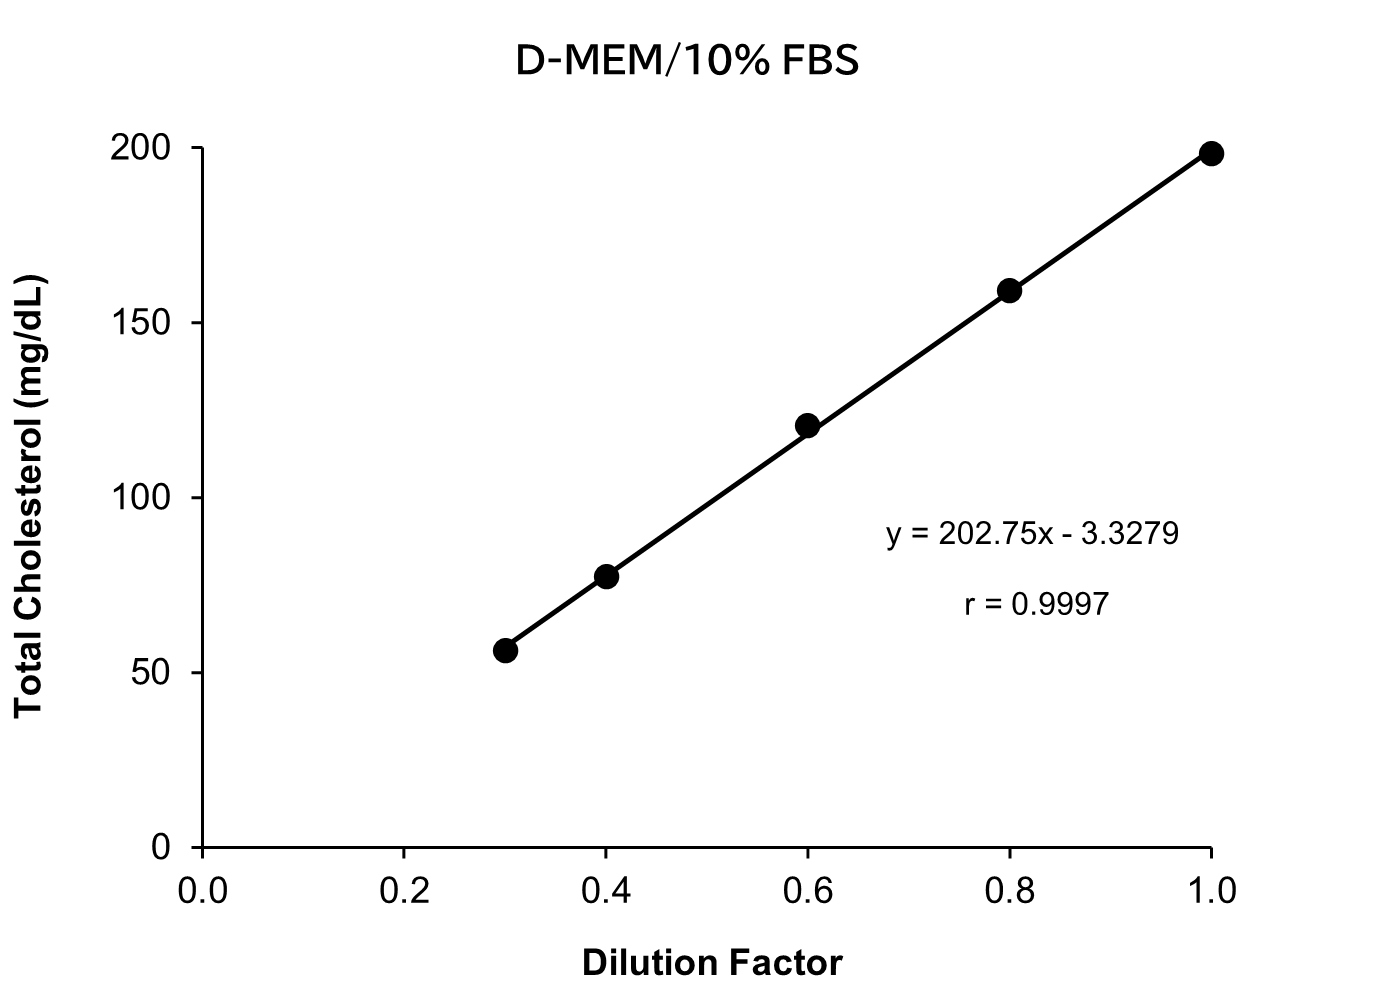
[Result]
All measurement results showed good linearity within the measurement range.
Spike and Recovery Test
Standard solutions at four concentrations were added to serum/plasma (EDTA) from human, mouse and rat as well as D-MEM containing 10% FBS. Next, spike recovery tests were conducted, with each measurement performed in duplicate.
Human sample
| Spiked amount (mg/dL) |
Measurement value (mg/dL) |
Recovery volume (mg/dL) |
Recovery rate (%) |
|
|---|---|---|---|---|
| Serum | - | 166.4 | - | - |
| 47.6 | 219.1 | 52.6 | 111 | |
| 99.7 | 276.1 | 109.7 | 110 | |
| 150.4 | 326.3 | 159.9 | 106 | |
| 201.3 | 378.3 | 211.9 | 105 | |
| Average | 108 | |||
| Plasma (EDTA) |
- | 130.2 | - | - |
| 47.6 | 181.0 | 50.8 | 107 | |
| 99.7 | 237.8 | 107.6 | 108 | |
| 150.4 | 280.5 | 150.3 | 100 | |
| 201.3 | 343.2 | 213.0 | 106 | |
| Average | 105 | |||
Mouse sample
| Spiked amount (mg/dL) |
Measurement value (mg/dL) |
Recovery volume (mg/dL) |
Recovery rate (%) |
|
|---|---|---|---|---|
| Serum | - | 86.1 | - | - |
| 47.6 | 136.1 | 50.0 | 105 | |
| 99.7 | 188.6 | 102.5 | 103 | |
| 150.4 | 239.3 | 153.2 | 102 | |
| 201.3 | 288.1 | 202.0 | 100 | |
| Average | 103 | |||
| Plasma (EDTA) |
- | 35.5 | - | - |
| 47.6 | 84.5 | 49.1 | 103 | |
| 99.7 | 134.4 | 98.9 | 99.2 | |
| 150.4 | 188.9 | 153.5 | 102 | |
| 201.3 | 230.6 | 195.1 | 96.9 | |
| Average | 100 | |||
Rat sample
| Spiked amount (mg/dL) |
Measurement value (mg/dL) |
Recovery volume (mg/dL) |
Recovery rate (%) |
|
|---|---|---|---|---|
| Serum | - | 69.9 | - | - |
| 47.6 | 121.5 | 51.6 | 108 | |
| 99.7 | 161.8 | 91.9 | 92.2 | |
| 150.4 | 220.8 | 150.8 | 100 | |
| 201.3 | 276.8 | 206.9 | 103 | |
| Average | 101 | |||
| Plasma (EDTA) |
- | 42.6 | - | - |
| 47.6 | 91.8 | 49.2 | 106 | |
| 99.7 | 137.6 | 95.0 | 105 | |
| 150.4 | 180.1 | 137.5 | 98.3 | |
| 201.3 | 235.8 | 193.2 | 98.6 | |
| Average | 102 | |||
D-MEM
| Spiked amount (mg/dL) |
Measurement value (mg/dL) |
Recovery volume (mg/dL) |
Recovery rate (%) |
|
|---|---|---|---|---|
| 50% culture medium +standard solution |
- | 3.22 | - | - |
| 80.0 | 84.3 | 81.1 | 101 | |
| 122.5 | 127.9 | 124.7 | 102 | |
| 157.1 | 163.3 | 160.1 | 102 | |
| 197.1 | 199.1 | 195.9 | 99.4 | |
| Average | 101 | |||
[Result]
Good recovery rates were confirmed.
Measurement Using Actual Samples
Human sample
| ID\n | Measurement value (mg/dL) | mean | SD | CV (%) |
||
|---|---|---|---|---|---|---|
| 1 | 2 | |||||
| Serum | ID1 | 191.7 | 173.6 | 182.7 | 12.80 | 7.0 |
| Plasma | ID1 | 143.2 | 143.1 | 143.2 | 0.07071 | 0.0 |
Rat sample (S.D. rat)
| ID\n | Measurement value (mg/dL) | mean | SD | CV (%) |
||
|---|---|---|---|---|---|---|
| 1 | 2 | |||||
| Serum | ID1 | 60.0 | 67.1 | 63.6 | 5.02 | 7.9 |
| ID2 | 84.6 | 89.0 | 86.8 | 3.11 | 3.6 | |
| ID3 | 90.7 | 80.8 | 85.8 | 7.00 | 8.2 | |
| ID4 | 82.1 | 72.3 | 77.2 | 6.93 | 9.0 | |
| ID5 | 89.3 | 93.9 | 91.6 | 3.25 | 3.6 | |
| Plasma (EDTA) |
ID1 | 42.9 | 38.6 | 40.8 | 3.04 | 7.5 |
| ID2 | 59.3 | 54.3 | 56.8 | 3.54 | 6.2 | |
| ID3 | 51.1 | 46.3 | 48.7 | 3.39 | 7.0 | |
| ID4 | 45.2 | 40.2 | 42.7 | 3.54 | 8.3 | |
| ID5 | 59.2 | 63.7 | 61.5 | 3.18 | 5.2 | |
Mouse sample (CD-1(ICR))
| ID\n | Measurement value (mg/dL) | mean | SD | CV (%) |
||
|---|---|---|---|---|---|---|
| 1 | 2 | |||||
| Serum | ID1 | 95.4 | 89.3 | 92.4 | 4.31 | 4.7 |
| ID2 | 85.3 | 84.5 | 84.9 | 0.566 | 0.7 | |
| ID3 | 68.6 | 71.0 | 69.8 | 1.70 | 2.4 | |
| ID4 | 80.9 | 73.6 | 77.3 | 5.16 | 6.7 | |
| ID5 | 64.8 | 66.8 | 65.8 | 1.41 | 2.1 | |
| Plasma (EDTA) |
ID1 | 41.2 | 39.1 | 40.2 | 1.48 | 3.7 |
| ID2 | 43.7 | 40.8 | 42.3 | 2.05 | 4.9 | |
| ID3 | 35.8 | 38.7 | 37.3 | 2.05 | 5.5 | |
| ID4 | 43.1 | 41.4 | 42.3 | 1.20 | 2.8 | |
| ID5 | 39.3 | 40.7 | 40.0 | 0.990 | 2.5 | |
Dog sample (Beagle)
| ID\n | Measurement value (mg/dL) | mean | SD | CV (%) |
||
|---|---|---|---|---|---|---|
| 1 | 2 | |||||
| Serum | ID1 | 155.7 | 144.1 | 149.9 | 8.202 | 5.5 |
| ID2 | 95.2 | 95.2 | 95.2 | 0.00 | 0.0 | |
| ID3 | 127.4 | 119.2 | 123.3 | 5.798 | 4.7 | |
| ID4 | 112.9 | 120.4 | 116.7 | 5.303 | 4.5 | |
| ID5 | 225.1 | 240.8 | 233.0 | 11.10 | 4.8 | |
| ID6 | 119.7 | 115.1 | 117.4 | 3.253 | 2.8 | |
| ID7 | 110.9 | 97.6 | 104.3 | 9.405 | 9.0 | |
| ID8 | 102.5 | 100.5 | 101.5 | 1.414 | 1.4 | |
| Plasma (EDTA) |
ID1 | 146.6 | 135.8 | 141.2 | 7.637 | 5.4 |
| ID2 | 119.7 | 130.2 | 125.0 | 7.425 | 5.9 | |
| ID3 | 157.1 | 164.6 | 160.9 | 5.303 | 3.3 | |
| ID4 | 122.2 | 133.9 | 128.1 | 8.273 | 6.5 | |
| ID5 | 132.2 | 129.4 | 130.8 | 1.980 | 1.5 | |
| ID6 | 133.8 | 154.3 | 144.1 | 14.50 | 10.1 | |
| ID7 | 117.4 | 119.5 | 118.5 | 1.485 | 1.3 | |
| ID8 | 103.6 | 111.6 | 107.6 | 5.657 | 5.3 | |
Cat sample (Short hair)
| ID\n | Measurement value (mg/dL) | mean | SD | CV (%) |
||
|---|---|---|---|---|---|---|
| 1 | 2 | |||||
| Serum | ID1 | 108.1 | 110.5 | 109.3 | 1.697 | 1.6 |
| ID2 | 80.4 | 81.9 | 81.2 | 1.06 | 1.3 | |
| ID3 | 97.5 | 96.5 | 97.0 | 0.707 | 0.7 | |
| ID4 | 105.1 | 107.3 | 106.2 | 1.556 | 1.5 | |
| ID5 | 98.0 | 102.0 | 100.0 | 2.828 | 2.8 | |
| ID6 | 103.0 | 99.8 | 101.4 | 2.263 | 2.2 | |
| ID7 | 129.5 | 128.3 | 128.9 | 0.8485 | 0.7 | |
| ID8 | 71.0 | 70.4 | 70.7 | 0.424 | 0.6 | |
| Plasma (EDTA) |
ID1 | 88.5 | 86.6 | 87.6 | 1.34 | 1.5 |
| ID2 | 53.8 | 54.7 | 54.3 | 0.636 | 1.2 | |
| ID3 | 78.0 | 77.9 | 78.0 | 0.0707 | 0.1 | |
| ID4 | 73.3 | 75.1 | 74.2 | 1.27 | 1.7 | |
| ID5 | 80.4 | 80.9 | 80.7 | 0.354 | 0.4 | |
| ID6 | 60.0 | 60.4 | 60.2 | 0.283 | 0.5 | |
| ID7 | 71.5 | 72.4 | 72.0 | 0.636 | 0.9 | |
| ID8 | 87.5 | 90.6 | 89.1 | 2.19 | 2.5 | |
FAQ
About calibration curve
- Are there any precautions to consider when generating the calibration curve?
- When purified water is measured as a sample, the absorbance should be 0.11 or less. When a 200 mg/dL cholesterol standard solution is measured, the absorbance should range from 0.11 to 0.65. If the absorbance values differ significantly from these criteria, repeat the measurement.
About sample
- Is there any influence from substances that interfere with measurement (ascorbic acid, bilirubin, etc.)?
- Ascorbic acid and bilirubin have almost no effect on the measured values.
About kit usage
- What instruments, and equipment are required for the assay using this kit?
- The instruments and equipment required for the use of this kit are listed below.
- 96 well microplate (transparent type)
- Micropipette
- Plate mixer*
- Incubator maintaining at 37°C*
- Microplate reader with 600 nm wavelength filter
(*This is not necessary depending on the model of the microplate reader.)
(For Test Tube method)
- Test tube
- Pipette
- Incubator maintaining at 37°C
- Spectrophotometer or colorimeter with 600 nm wavelength filter
- How should I use the standard solution?
- Use the supplied standard solution as is or dilute it as necessary to prepare five standard concentrations according to the instructions provided in the “Package Insert” available in the Document section of this page.
- What are the storage conditions and shelf-life guidelines for each reagent?
- Chromogen Reagent :
Chromogen reagent is prepared by dissolving 1 vial of Chromogen Substrate with 1 vial of Buffer Solution. After adjustment, it may be stored at 2°C - 10°C for up to 3 weeks.
Overview / Applications
Property
Manufacturer Information
Alias
- LabAssay
635-50981 (Previous code)
LABCHO-M1 (Previous code)
294-65801 (Previous code)
For research use or further manufacturing use only. Not for use in diagnostic procedures.
Product content may differ from the actual image due to minor specification changes etc.
If the revision of product standards and packaging standards has been made, there is a case where the actual product specifications and images are different.
The prices are list prices in Japan.Please contact your local distributor for your retail price in your region.