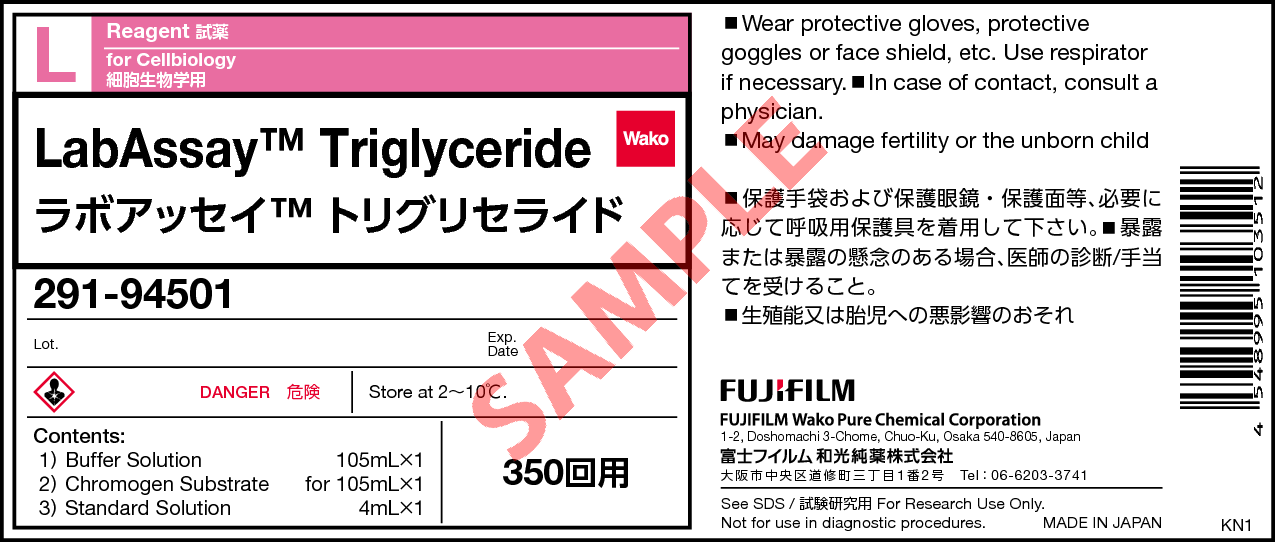
LabAssay™ Triglyceride
- for Cellbiology
- Manufacturer :
- FUJIFILM Wako Pure Chemical Corporation
- Storage Condition :
- Keep at 2-10 degrees C.
- GHS :
-


-
 Close
Close -
 Close
Close
- Structural Formula
- Label
- Packing
- SDS
|
Comparison
|
Product Number
|
Package Size
|
Price
|
Inventory
|
|
|---|---|---|---|---|---|
|
|
|
350Tests
|
|
In stock in Japan |
Please check here for notes on products and prices.
Document
Kit component
For 350 tests
| Buffer Solution | 105 mL x 1 bottle |
|---|---|
| Chromogen Substrate | for 105 mL x 1 bottle |
| Standard Solution | 4 mL x 1 bottle |
Product Overview
Triglycerides are neutral fats consisting of three fatty acids esterified to a glycerol backbone. There are triglycerides, cholesterol, phospholipids, free fatty acids and fat-soluble vitamins as lipid-soluble substances in the blood.
LabAssay™ Triglyceride is a kit based on an enzymatic colorimetric method (GPO-DAOS method) using the Trinder reagent. With the use of the enzymes and a microplate, this kit provides a convenient method for measuring triglycerides in samples.
Kit Performance
| Analysis sample | Human Serum/Plasma Mouse Serum/Plasma Rat Serum/Plasma Dog Serum/Plasma Cat Serum/Plasma |
|---|---|
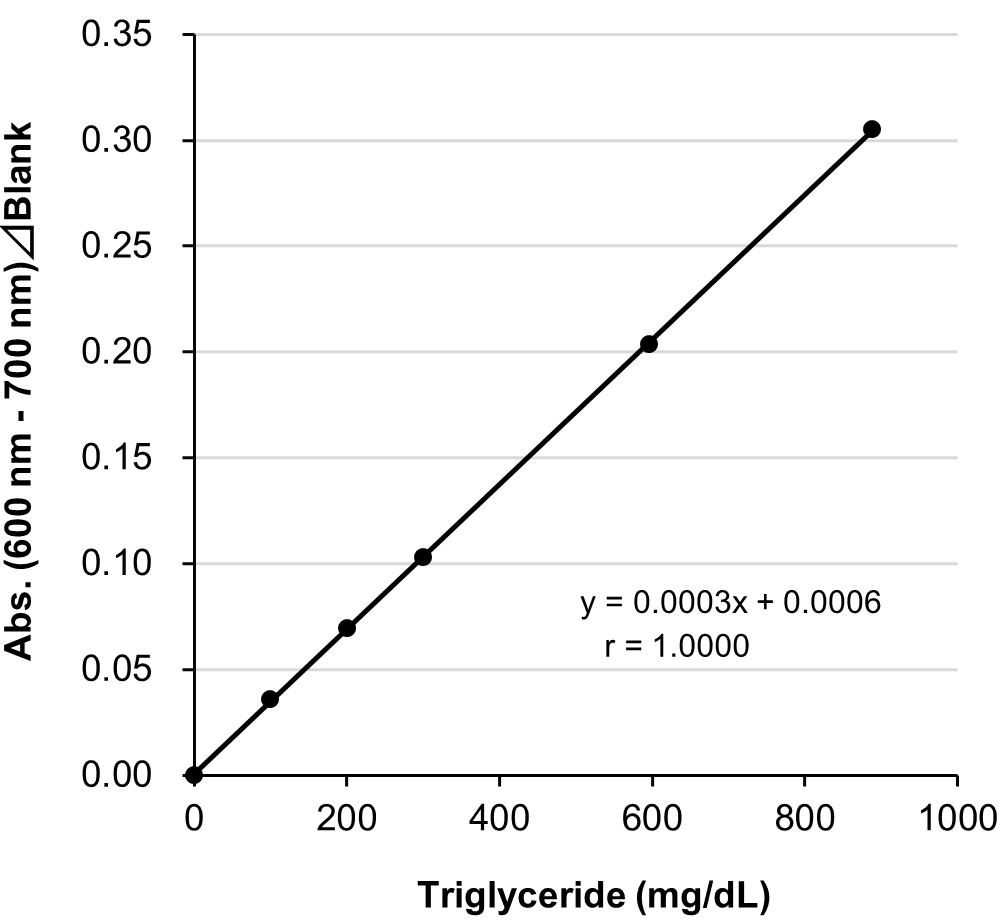
| Calibration curve range | 100-888 mg/dL |
| Sample volume | 2 μL |
| Measurement duration | Approx. 10 min |
| Wavelength | Primary wavelength 600 nm Reference wavelength 700 nm |
Example of Calibration Curve
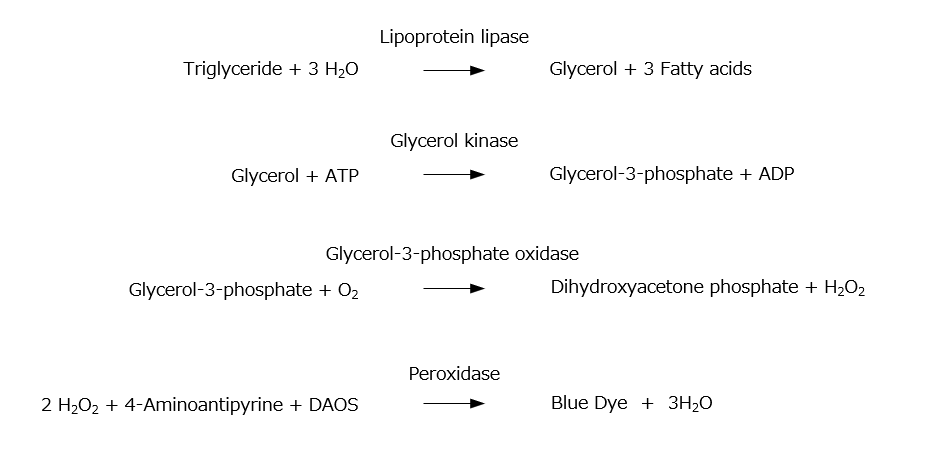
Assay Principle
Triglycerides are converted to glycerol-3-phosphate by lipoprotein lipase and glycerolkinase. Hydrogen peroxide, which is produced by a reaction between the glycerol-3-phosphate and glycerol-3-phosphate oxidase (GPO), promotes oxidative condensation of N-ethyl-N-(2-hydroxy-3-sulfopropyl)-3,5-dimethoxyaniline sodium salt (DAOS) with 4-aminoantipyrine. LabAssay™ Triglyceride can be used to detect triglycerides concentration in samples by measuring absorbance of a blue color which is generated by the oxidative condensation reaction.
Procedure
Perform the assay in the wells according to the following table scheme.
| Test | Standard | Blank | |
|---|---|---|---|
| Chromogen reagent | 300 μL | 300 μL | 300 μL |
| Sample | Serum 2 μL | Standard solution 2 μL | - |
| Mix well and incubate at 37 ℃ for 5 min. Measure the absorbance at 600 nm*1 of the test sample and standard solution with the blank solution as the control. | |||
*1: In two wavelength assay, measure using Primary wavelength 600 nm/Reference wavelength 700 nm.
Data
Repeatability (within run precision)
Repeatability was conducted by measuring sixfold assays of serum samples from human, mouse and rat at two concentrations with this product.
| n\ID | Human serum | Mouse serum | Rat serum | |||
|---|---|---|---|---|---|---|
| ID1 (mg/dL) | ID2 (mg/dL) | ID1 (mg/dL) | ID2 (mg/dL) | ID1 (mg/dL) | ID2 (mg/dL) | |
| 1 | 195 | 328 | 142 | 392 | 118 | 199 |
| 2 | 191 | 328 | 143 | 378 | 119 | 200 |
| 3 | 198 | 330 | 134 | 389 | 115 | 195 |
| 4 | 196 | 323 | 135 | 365 | 113 | 193 |
| 5 | 185 | 322 | 135 | 383 | 115 | 182 |
| 6 | 197 | 328 | 142 | 386 | 114 | 180 |
| mean | 194 | 327 | 139 | 382 | 116 | 192 |
| SD | 4.89 | 3.21 | 4.23 | 9.70 | 2.34 | 8.55 |
| CV(%) | 2.5 | 1.0 | 3.1 | 2.5 | 2.0 | 4.5 |
[Result]
The CV (%) of human serum was 1.0-2.5%, mouse serum was 2.5-3.1% and rat serum was 2.0-4.5%, indicating good repeatability.
Reproducibility (between run precision)
Reproducibility was conducted by measuring serum samples from human, mouse and rat at three concentrations each for four days with this product.
| Day\ID | Human serum | Mouse serum | Rat serum | ||||||
|---|---|---|---|---|---|---|---|---|---|
| ID3 (mg/dL) | ID4 (mg/dL) | ID5 (mg/dL) | ID3 (mg/dL) | ID4 (mg/dL) | ID5 (mg/dL) | ID3 (mg/dL) | ID4 (mg/dL) | ID5 (mg/dL) | |
| 1 | 537 | 261 | 135 | 566 | 263 | 150 | 568 | 268 | 143 |
| 2 | 552 | 275 | 137 | 558 | 259 | 140 | 614 | 276 | 144 |
| 3 | 554 | 275 | 135 | 540 | 263 | 139 | 592 | 275 | 144 |
| 4 | 546 | 272 | 137 | 587 | 294 | 137 | 609 | 287 | 141 |
| mean | 547 | 271 | 136 | 563 | 270 | 142 | 596 | 277 | 143 |
| SD | 7.63 | 6.65 | 1.15 | 19.5 | 16.3 | 5.80 | 20.8 | 7.85 | 1.41 |
| CV(%) | 1.4 | 2.5 | 0.8 | 3.5 | 6.0 | 4.1 | 3.5 | 2.8 | 1.0 |
[Result]
The CV (%) of human serum was 0.8-2.5%, mouse serum was 3.5-6.0% and rat serum was 1.0-3.5%, indicating good reproducibility.
Dilution Linearity Test
Human, mouse and rat samples spiked with the standard, were serially diluted twofold with saline and measured in duplicate to assess linearity.
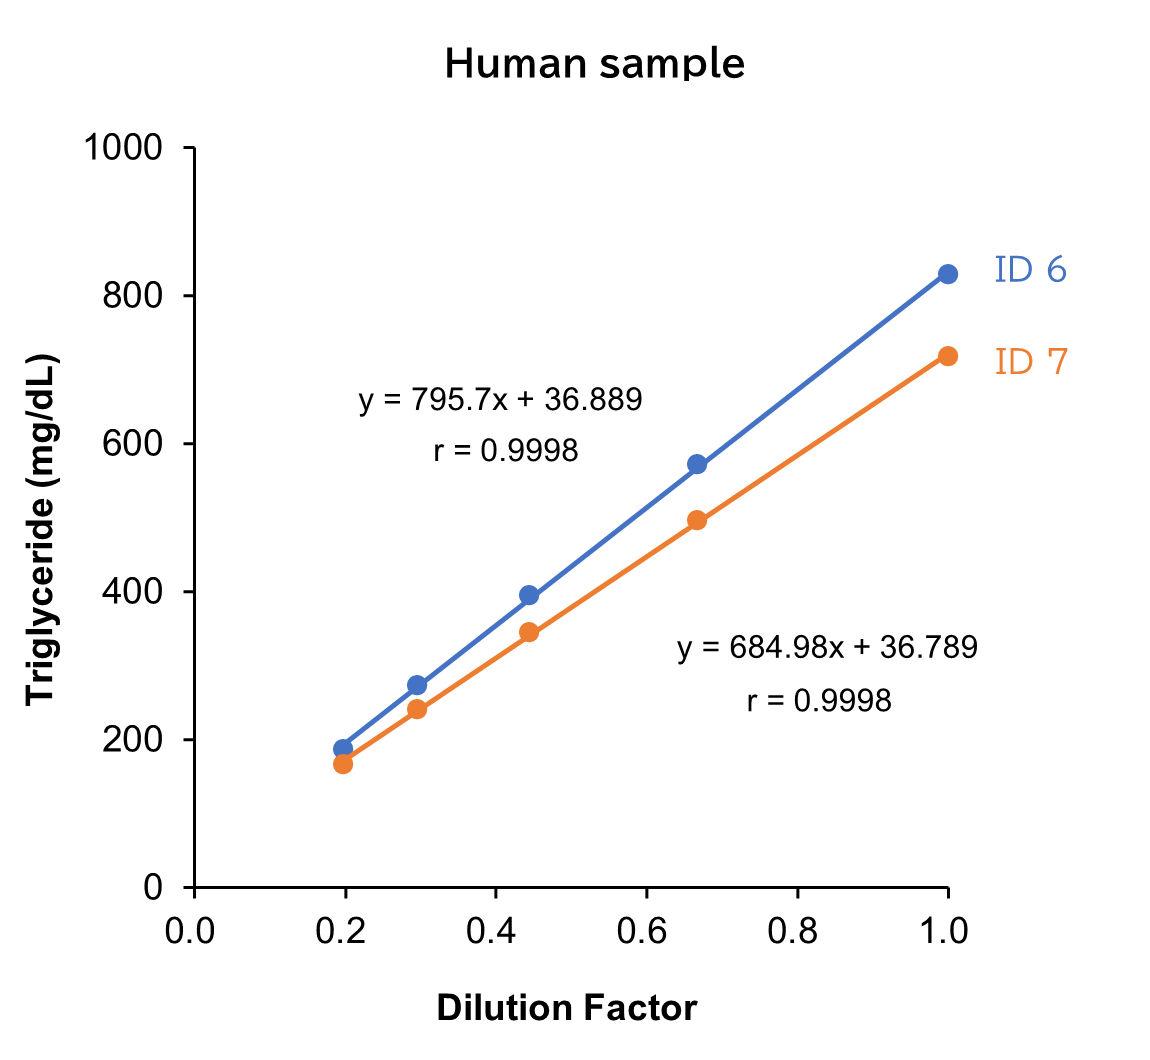
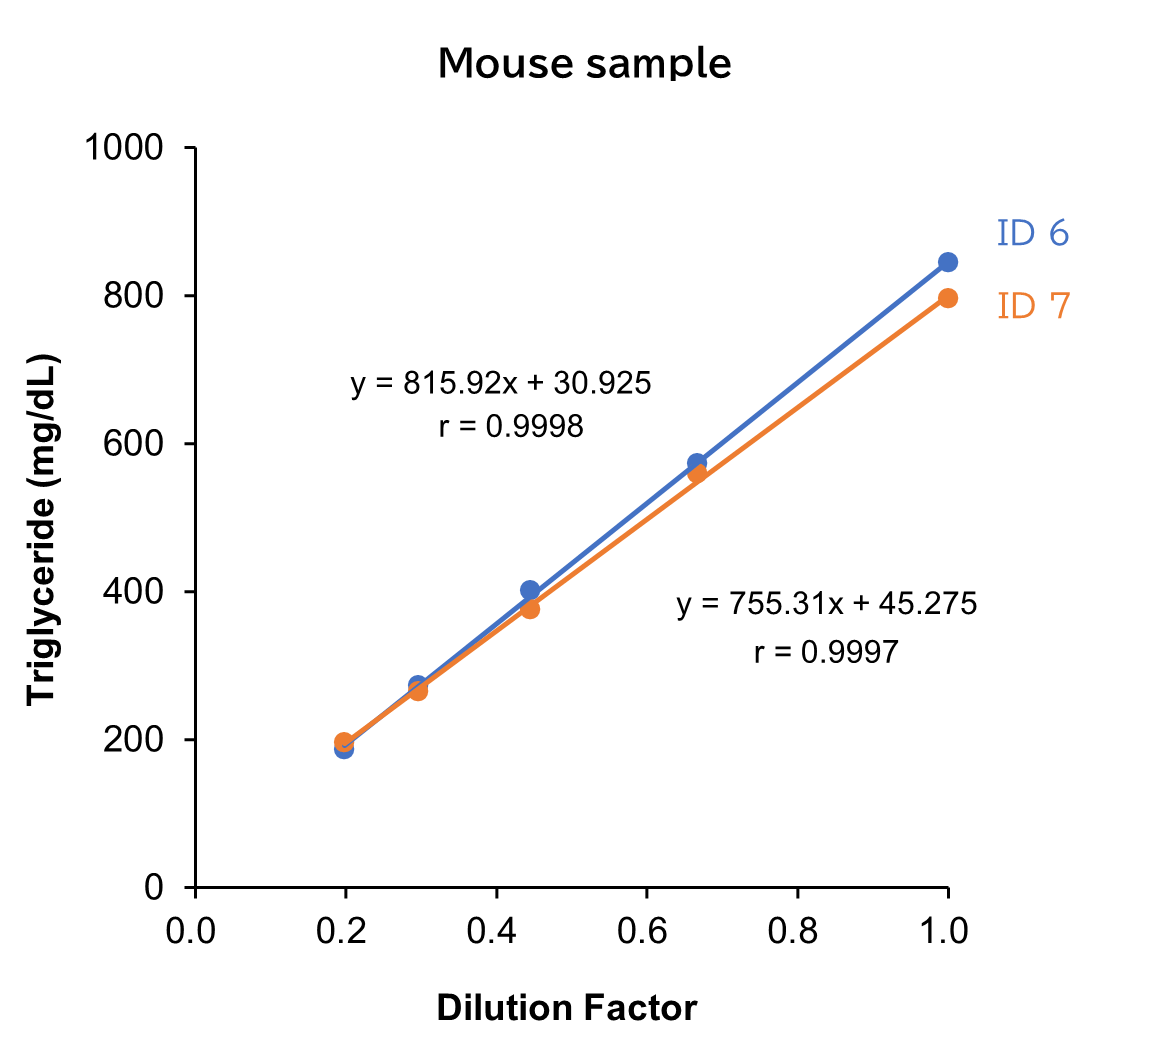
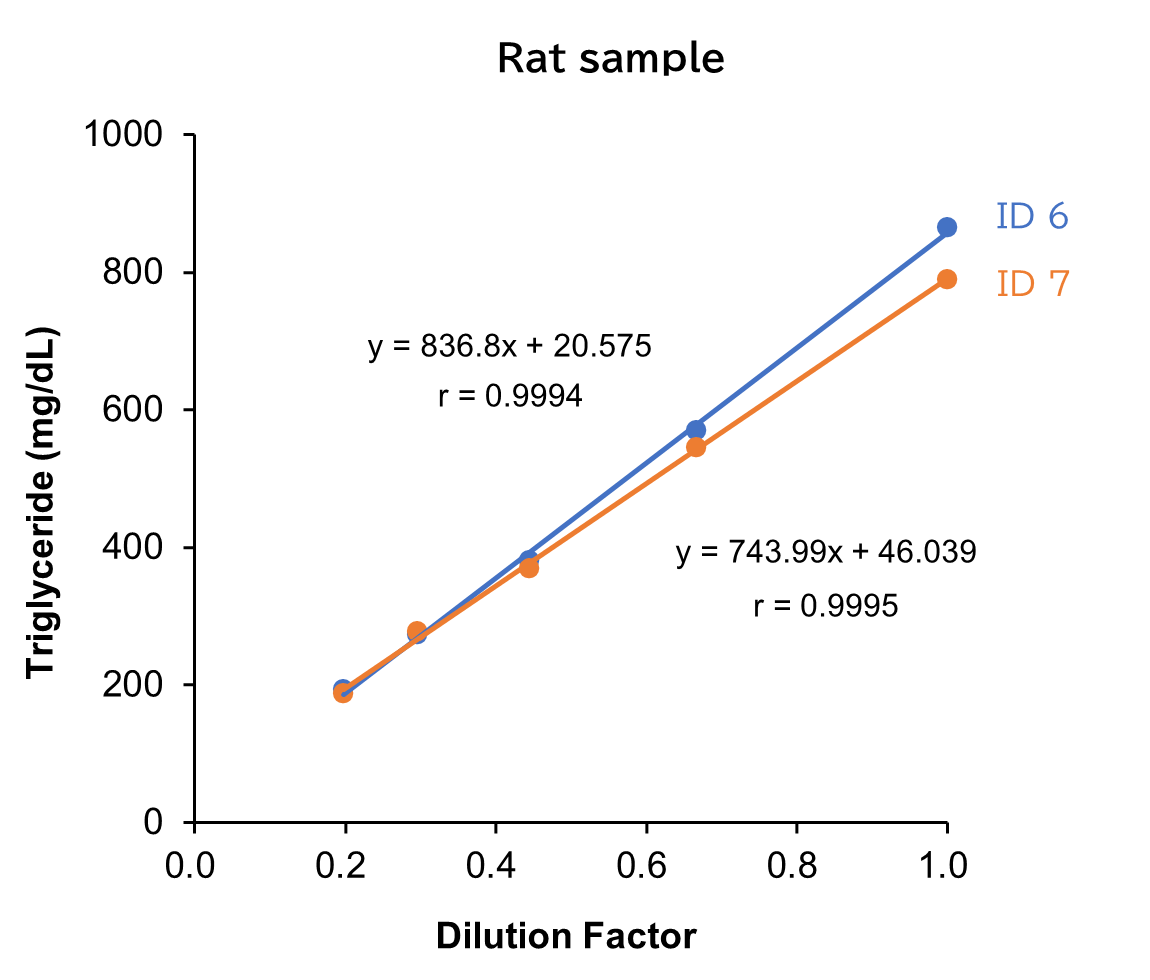
[Result]
All measurement results showed good linearity within the measurement range.
Spike and Recovery Test
Standard solutions at four concentrations were added to serum/plasma (EDTA, heparin) from human, mouse and rat. Next, spike recovery tests were conducted, with each measurement performed in duplicate.
Human sample
| Spiked amount (mmol/L) |
Measurement value (mmol/L) |
Recovery volume (mmol/L) |
Recovery rate (%) |
|
|---|---|---|---|---|
| Serum | - | 126 | - | - |
| 145 | 267 | 141 | 97.2 | |
| 218 | 323 | 196 | 89.9 | |
| 291 | 389 | 263 | 90.4 | |
| 363 | 455 | 329 | 90.6 | |
| Average | 92.0 | |||
| Plasma (EDTA) |
- | 136 | - | - |
| 150 | 276 | 140 | 93.3 | |
| 225 | 329 | 193 | 85.8 | |
| 300 | 414 | 278 | 92.7 | |
| 374 | 460 | 324 | 86.6 | |
| Average | 89.6 | |||
| Plasma (heparin) |
- | 135 | - | |
| 150 | 269 | 134 | 89.3 | |
| 226 | 320 | 186 | 82.3 | |
| 301 | 394 | 260 | 86.4 | |
| 376 | 457 | 322 | 85.6 | |
| Average | 85.9 | |||
Mouse sample
| Spiked amount (mmol/L) |
Measurement value (mmol/L) |
Recovery volume (mmol/L) |
Recovery rate (%) |
|
|---|---|---|---|---|
| Serum | - | 133 | - | - |
| 129 | 268 | 136 | 98.3 | |
| 194 | 342 | 209 | 90.6 | |
| 258 | 409 | 276 | 88.8 | |
| 323 | 448 | 315 | 93.8 | |
| Average | 92.9 | |||
| Plasma (EDTA) |
- | 139 | - | - |
| 129 | 288 | 149 | 95.9 | |
| 193 | 342 | 203 | 97.5 | |
| 258 | 409 | 270 | 98.0 | |
| 322 | 446 | 307 | 97.4 | |
| Average | 97.2 | |||
| Plasma (heparin) |
- | 151 | - | |
| 132 | 292 | 141 | 107 | |
| 198 | 349 | 198 | 100 | |
| 264 | 423 | 272 | 103 | |
| 329 | 442 | 291 | 88.4 | |
| Average | 100 | |||
Rat sample
| Spiked amount (mmol/L) |
Measurement value (mmol/L) |
Recovery volume (mmol/L) |
Recovery rate (%) |
|
|---|---|---|---|---|
| Serum | - | 130 | - | - |
| 131 | 257 | 127 | 96.9 | |
| 196 | 307 | 177 | 90.3 | |
| 262 | 370 | 240 | 91.6 | |
| 327 | 413 | 283 | 86.5 | |
| Average | 91.4 | |||
| Plasma (EDTA) |
- | 128 | - | - |
| 135 | 256 | 128 | 94.8 | |
| 203 | 312 | 183 | 90.1 | |
| 271 | 374 | 245 | 90.4 | |
| 338 | 401 | 272 | 80.5 | |
| Average | 89.0 | |||
| Plasma (heparin) |
- | 123 | - | |
| 134 | 257 | 134 | 100 | |
| 201 | 305 | 182 | 90.5 | |
| 268 | 365 | 242 | 90.3 | |
| 335 | 400 | 278 | 83.0 | |
| Average | 91.0 | |||
[Result]
Good recovery rates were confirmed.
Measurement Using Actual Samples
Human sample
| ID\n | Measurement value (mmol/L) | mean | SD | CV (%) |
||
|---|---|---|---|---|---|---|
| 1 | 2 | |||||
| Serum | ID1 | 123 | 129 | 126 | 4.24 | 3.4 |
| Plasma (EDTA) | ID1 | 137 | 135 | 136 | 1.41 | 1.0 |
Rat sample (S.D. rat)
| ID\n | Measurement value (mmol/L) | mean | SD | CV (%) |
||
|---|---|---|---|---|---|---|
| 1 | 2 | |||||
| Serum | ID1 | 54.5 | 53.1 | 53.8 | 0.990 | 1.8 |
| ID2 | 153 | 153 | 153 | 0.00 | 0.0 | |
| ID3 | 105 | 95.8 | 100 | 6.51 | 6.5 | |
| ID4 | 120 | 125 | 123 | 3.54 | 2.9 | |
| ID5 | 102 | 107 | 105 | 3.54 | 3.4 | |
| Plasma (EDTA) |
ID1 | 56.8 | 64.3 | 60.6 | 5.30 | 8.8 |
| ID2 | 73.2 | 67.2 | 70.2 | 4.24 | 6.0 | |
| ID3 | 95.1 | 85.5 | 90.3 | 6.79 | 7.5 | |
| ID4 | 68.5 | 63.8 | 66.2 | 3.32 | 5.0 | |
| ID5 | 76.2 | 68.9 | 72.6 | 5.16 | 7.1 | |
Mouse sample (CD-1(ICR))
| ID\n | Measurement value (mmol/L) | mean | SD | CV (%) |
||
|---|---|---|---|---|---|---|
| 1 | 2 | |||||
| Serum | ID1 | 80.8 | 77.9 | 79.4 | 2.05 | 2.6 |
| ID2 | 78.4 | 76.7 | 77.6 | 1.20 | 1.6 | |
| ID3 | 81.3 | 75.6 | 78.5 | 4.03 | 5.1 | |
| ID4 | 57.4 | 60.3 | 58.9 | 2.05 | 3.5 | |
| ID5 | 48.7 | 53.3 | 51.0 | 3.25 | 6.4 | |
| Plasma (EDTA) |
ID1 | 28.8 | 31.7 | 30.3 | 2.05 | 6.8 |
| ID2 | 132 | 145 | 139 | 9.19 | 6.6 | |
| ID3 | 62.7 | 68.0 | 65.4 | 3.75 | 5.7 | |
| ID4 | 29.5 | 25.8 | 27.7 | 2.62 | 9.5 | |
| ID5 | 58.8 | 55.1 | 57.0 | 2.62 | 4.6 | |
Dog sample (Beagle)
| ID\n | Measurement value (mmol/L) | mean | SD | CV (%) |
||
|---|---|---|---|---|---|---|
| 1 | 2 | |||||
| Serum | ID1 | 35.6 | 39.7 | 37.7 | 2.90 | 7.7 |
| ID2 | 33.8 | 37.0 | 35.4 | 2.26 | 6.4 | |
| ID3 | 28.6 | 31.0 | 29.8 | 1.70 | 5.7 | |
| ID4 | 102 | 109 | 106 | 4.95 | 4.7 | |
| ID5 | 37.3 | 34.2 | 35.8 | 2.19 | 6.1 | |
| ID6 | 25.3 | 24.4 | 24.9 | 0.636 | 2.6 | |
| ID7 | 18.6 | 16.5 | 17.6 | 1.48 | 8.5 | |
| ID8 | 47.7 | 42.7 | 45.2 | 3.54 | 7.8 | |
| Plasma (EDTA) |
ID1 | 37.2 | 33.9 | 35.6 | 2.33 | 6.6 |
| ID2 | 29.0 | 27.6 | 28.3 | 0.990 | 3.5 | |
| ID3 | 32.5 | 36.0 | 34.3 | 2.47 | 7.2 | |
| ID4 | 33.5 | 36.4 | 35.0 | 2.05 | 5.9 | |
| ID5 | 33.2 | 30.3 | 31.8 | 2.05 | 6.5 | |
| ID6 | 24.9 | 22.9 | 23.9 | 1.41 | 5.9 | |
| ID7 | 31.9 | 28.4 | 30.2 | 2.47 | 8.2 | |
| ID8 | 63.2 | 57.0 | 60.1 | 4.38 | 7.3 | |
Cat sample
| ID\n | Measurement value (mmol/L) | mean | SD | CV (%) |
||
|---|---|---|---|---|---|---|
| 1 | 2 | |||||
| Serum | ID1 | 32.4 | 35.9 | 34.2 | 2.47 | 7.2 |
| ID2 | 18.4 | 20.2 | 19.3 | 1.27 | 6.6 | |
| ID3 | 33.9 | 36.6 | 35.3 | 1.91 | 5.4 | |
| ID4 | 48.9 | 53.8 | 51.4 | 3.46 | 6.7 | |
| ID5 | 33.9 | 32.8 | 33.4 | 0.778 | 2.3 | |
| ID6 | 45.3 | 47.1 | 46.2 | 1.27 | 2.8 | |
| ID7 | 96.6 | 88.0 | 92.3 | 6.08 | 6.6 | |
| ID8 | 52.3 | 54.7 | 53.5 | 1.70 | 3.2 | |
| Plasma (EDTA) |
ID1 | 104 | 104 | 104 | 0.00 | 0.0 |
| ID2 | 34.3 | 31.8 | 33.1 | 1.77 | 5.3 | |
| ID3 | 54.8 | 49.3 | 52.1 | 3.89 | 7.5 | |
| ID4 | 65.1 | 60.7 | 62.9 | 3.11 | 4.9 | |
| ID5 | 43.9 | 44.4 | 44.2 | 0.354 | 0.8 | |
| ID6 | 29.0 | 31.9 | 30.5 | 2.05 | 6.7 | |
| ID7 | 16.8 | 16.2 | 16.5 | 0.424 | 2.6 | |
| ID8 | 25.0 | 27.2 | 26.1 | 1.56 | 6.0 | |
Reference
- YAMAMOTO, H. et al.: Japanese Journal of Medical Technology., 2, 65 (2015).
Comparative analysis of the total glyceride measurement method with the glycerol-blanked triglyceride measurement method: Toward the global standardization of triglyceride measurement.
FAQ
About sample
- Is there any influence from substances that interfere with measurement (ascorbic acid, bilirubin, etc.)?
- Hemolysis may cause a slight positive bias, and ascorbic acid may cause a slight negative bias. Bilirubin has little to no effect on the assay results.
About kit usage
- What instruments, and equipment are required for the assay using this kit?
- The instruments and equipment required for the use of this kit are listed below.
- 96 well microplate (transparent type)
- Micropipette
- Plate mixer*
- Incubator maintaining at 37°C*
- Microplate reader with 600 nm wavelength filter
(* if the microplate reader does not have a stirring function.)
(For Test Tube method)
- Test tube
- Piprtte
- Incubator maintaining at 37°C*
- Spectrophotometer or colorimeter with 600 nm wavelength filter
- Is triglyceride the only analyte measured?
- The analytes measured include not only triglycerides but also diglycerides, monoglycerides, and free glycerol. These components are enzymatically converted to glycerol prior to measurement; therefore, any glycerol present in the sample is included in the measured value. Glycerol is known to be present in blood; however, its concentration is very low compared with triglycerides (4.56 ± 3.48 mg/dL; see Reference 1).
The results obtained with this product are expressed as the concentration of triolein, the most abundant triglyceride in vivo. Although the glycerol concentration in the standard solution is 31.2 mg/dL, this corresponds to 300 mg/dL when converted to triolein equivalents, based on the molecular weights of glycerol (92.10) and triolein (885.40).
Overview / Applications
Property
Manufacturer Information
Alias
- LabAssay
632-50991 (Previous code)
LABTRIG-M1 (Previous code)
290-63701 (Previous code)
For research use or further manufacturing use only. Not for use in diagnostic procedures.
Product content may differ from the actual image due to minor specification changes etc.
If the revision of product standards and packaging standards has been made, there is a case where the actual product specifications and images are different.
The prices are list prices in Japan.Please contact your local distributor for your retail price in your region.