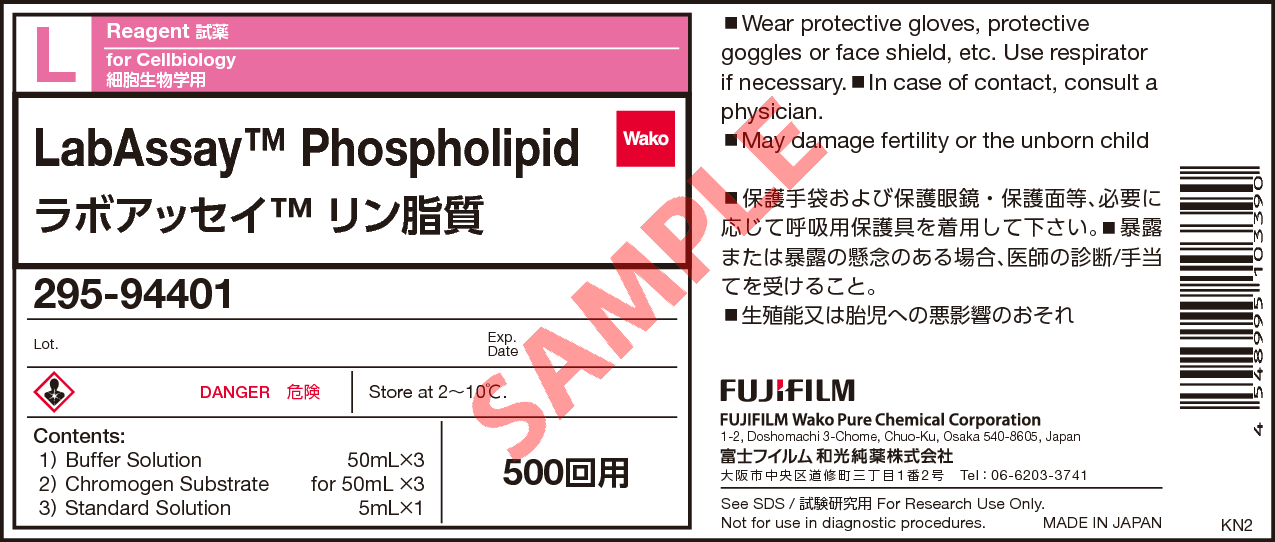
LabAssay (TM) Phospholipid
- for Cellbiology
- Manufacturer :
- FUJIFILM Wako Pure Chemical Corporation
- Storage Condition :
- Keep at 2-10 degrees C.
- GHS :
-


-
 Close
Close -
 Close
Close
- Structural Formula
- Label
- Packing
- SDS
|
Comparison
|
Product Number
|
Package Size
|
Price
|
Inventory
|
|
|---|---|---|---|---|---|
|
|
|
500Tests
|
|
In stock in Japan |
Please check here for notes on products and prices.
Document
Kit component
For 500 tests
| Buffer Solution | 50 mL x 3 bottles |
|---|---|
| Chromogen Substrate | for 50 mL x 3 bottles |
| Standard Solution | 5 mL x 1 bottle |
Product Overview
Phospholipids are known as not only as major component of cell membranes but also perform vital functions within the body such as emulsification and absorption of fats or coagulation of blood.
LabAssay™ Phospholipid is a kit designed to measure phospholipid in samples. With the use of microplate, this kit provides a quick and convenient method for measuring phospholipid in samples.
Kit Performance
| Analysis sample | Human Serum/Plasma Mouse Serum/Plasma Rat Serum/Plasma Dog Serum/Plasma Cat Serum/Plasma Culture medium (D-MEM)* |
|---|---|
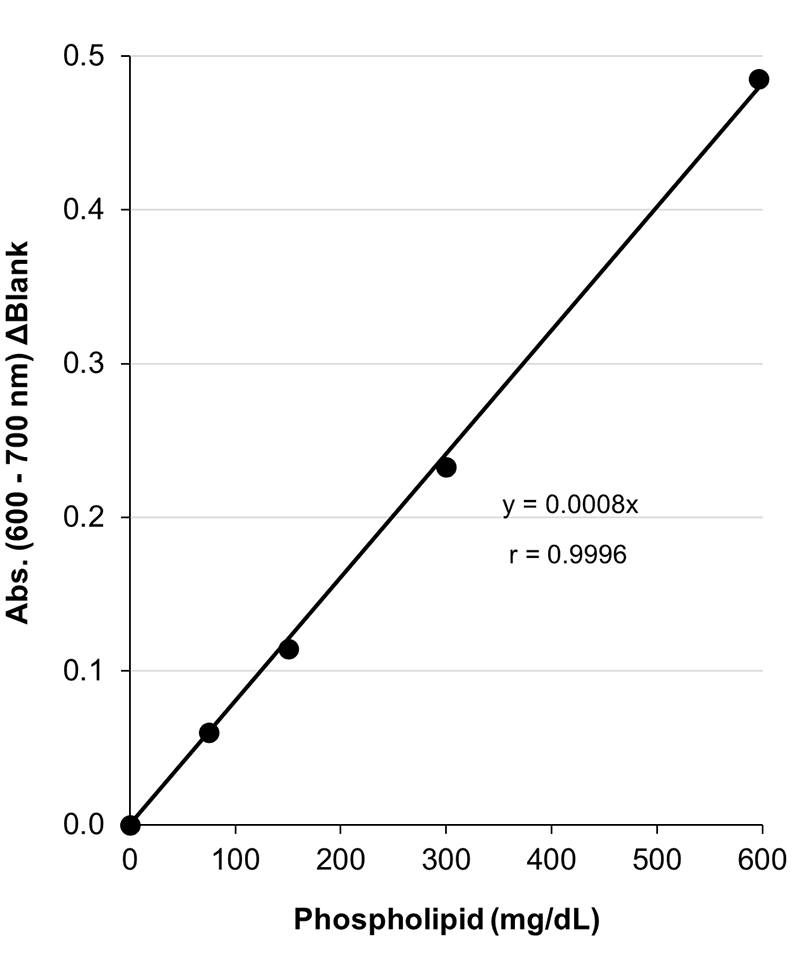
| Calibration curve range | 75.0-596.1 mg/dL |
| Sample volume | 2 μL |
| Measurement duration | Approx. 10 min |
| Wavelength | Primary wavelength 600 nm Reference wavelength 700 nm |
Measurement availability depends on the culture medium, cell type and culture conditions. Please perform a spiked recovery test or dilution linearity test in advance using the culture medium to be used in your experiment.
Example of Calibration Curve
Assay Principle
Phospholipids are hydrolyzed by Phospholipase D to release hydrogen peroxide. The formed hydrogen peroxide promotes oxidative condensation of N-ethyl-N-(2-hydroxy-3-sulfopropyl)-3,5-dimethoxyaniline sodium salt(DAOS) with 4-aminoantipyrine. This kit is designed to measure Phospholipid concentration in samples by measuring absorbance of a blue color which is generated by the oxidative condensation reaction.

Procedure
Perform the assay in the wells according to the following table scheme.
| Test | Standard | Blank | |
|---|---|---|---|
| Chromogen reagent | 300 μL | 300 μL | 300 μL |
| Sample | Serum 2 μL | Standard solution 2 μL | - |
| Mix well and incubate at 37℃ for 5 min. Measure the absorbance at 600 nm* of the test sample and standard solution with the blank solution as the control. | |||
*: In two wavelength assay, measure using Primary wavelength 600 nm/Reference wavelength 700 nm.
Data
Repeatability (within run precision)
Repeatability was conducted by measuring sixfold assays of serum samples from human, mouse and rat at two concentrations with this product.
| n\ID | Human serum | Mouse serum | Rat serum | |||
|---|---|---|---|---|---|---|
| ID1 (mg/dL) | ID2 (mg/dL) | ID1 (mg/dL) | ID2 (mg/dL) | ID1 (mg/dL) | ID2 (mg/dL) | |
| 1 | 525.6 | 207.1 | 591.8 | 279.0 | 459.8 | 144.3 |
| 2 | 524.4 | 213.3 | 582.4 | 285.1 | 458.6 | 147.4 |
| 3 | 517.6 | 221.7 | 573.8 | 286.4 | 456.7 | 143.3 |
| 4 | 510.5 | 215.3 | 583.5 | 287.9 | 453.0 | 145.8 |
| 5 | 515.8 | 212.0 | 592.2 | 266.0 | 444.4 | 144.6 |
| 6 | 515.9 | 215.6 | 592.3 | 270.2 | 448.1 | 147.2 |
| mean | 518.3 | 214.2 | 586.0 | 279.1 | 453.4 | 145.4 |
| SD | 5.724 | 4.806 | 7.481 | 9.138 | 6.134 | 1.652 |
| CV(%) | 1.1 | 2.2 | 1.3 | 3.3 | 1.4 | 1.1 |
[Result]
The CV (%) of human serum was 1.1-2.2%, mouse serum was 1.3-3.3% and rat serum was 1.1-1.4%, indicating good repeatability.
Reproducibility (between run precision)
Reproducibility was conducted by measuring serum samples from human, mouse and rat at three concentrations each for four days with this product.
| Day\ID | Human serum | Mouse serum | Rat serum | ||||||
|---|---|---|---|---|---|---|---|---|---|
| ID3 (mg/dL) | ID4 (mg/dL) | ID5 (mg/dL) | ID3 (mg/dL) | ID4 (mg/dL) | ID5 (mg/dL) | ID3 (mg/dL) | ID4 (mg/dL) | ID5 (mg/dL) | |
| 1 | 525.7 | 367.4 | 219.0 | 589.3 | 432.8 | 285.0 | 461.8 | 297.6 | 143.8 |
| 2 | 493.1 | 356.7 | 201.9 | 564.5 | 409.9 | 256.6 | 431.8 | 283.0 | 139.4 |
| 3 | 511.7 | 363.8 | 205.9 | 565.0 | 410.3 | 253.1 | 449.2 | 296.9 | 141.8 |
| 4 | 500.8 | 360.1 | 223.9 | 569.4 | 416.1 | 284.5 | 435.9 | 296.7 | 142.3 |
| mean | 507.8 | 362.0 | 212.7 | 572.1 | 417.3 | 269.8 | 444.7 | 293.6 | 141.8 |
| SD | 14.15 | 4.622 | 10.46 | 11.71 | 10.73 | 17.32 | 13.62 | 7.044 | 1.826 |
| CV(%) | 2.8 | 1.3 | 4.9 | 2.0 | 2.6 | 6.4 | 3.1 | 2.4 | 1.3 |
[Result]
The CV (%) of human serum was 1.3-4.9%, mouse serum was 2.0-6.4% and rat serum was 1.3-3.1%, indicating good reproducibility.
Dilution Linearity Test
Serum and plasma (EDTA) from human, mouse and rat, as well as D-MEM containing 10% FBS spiked with the standard, were serially diluted twofold with saline and measured in duplicate to assess linearity.
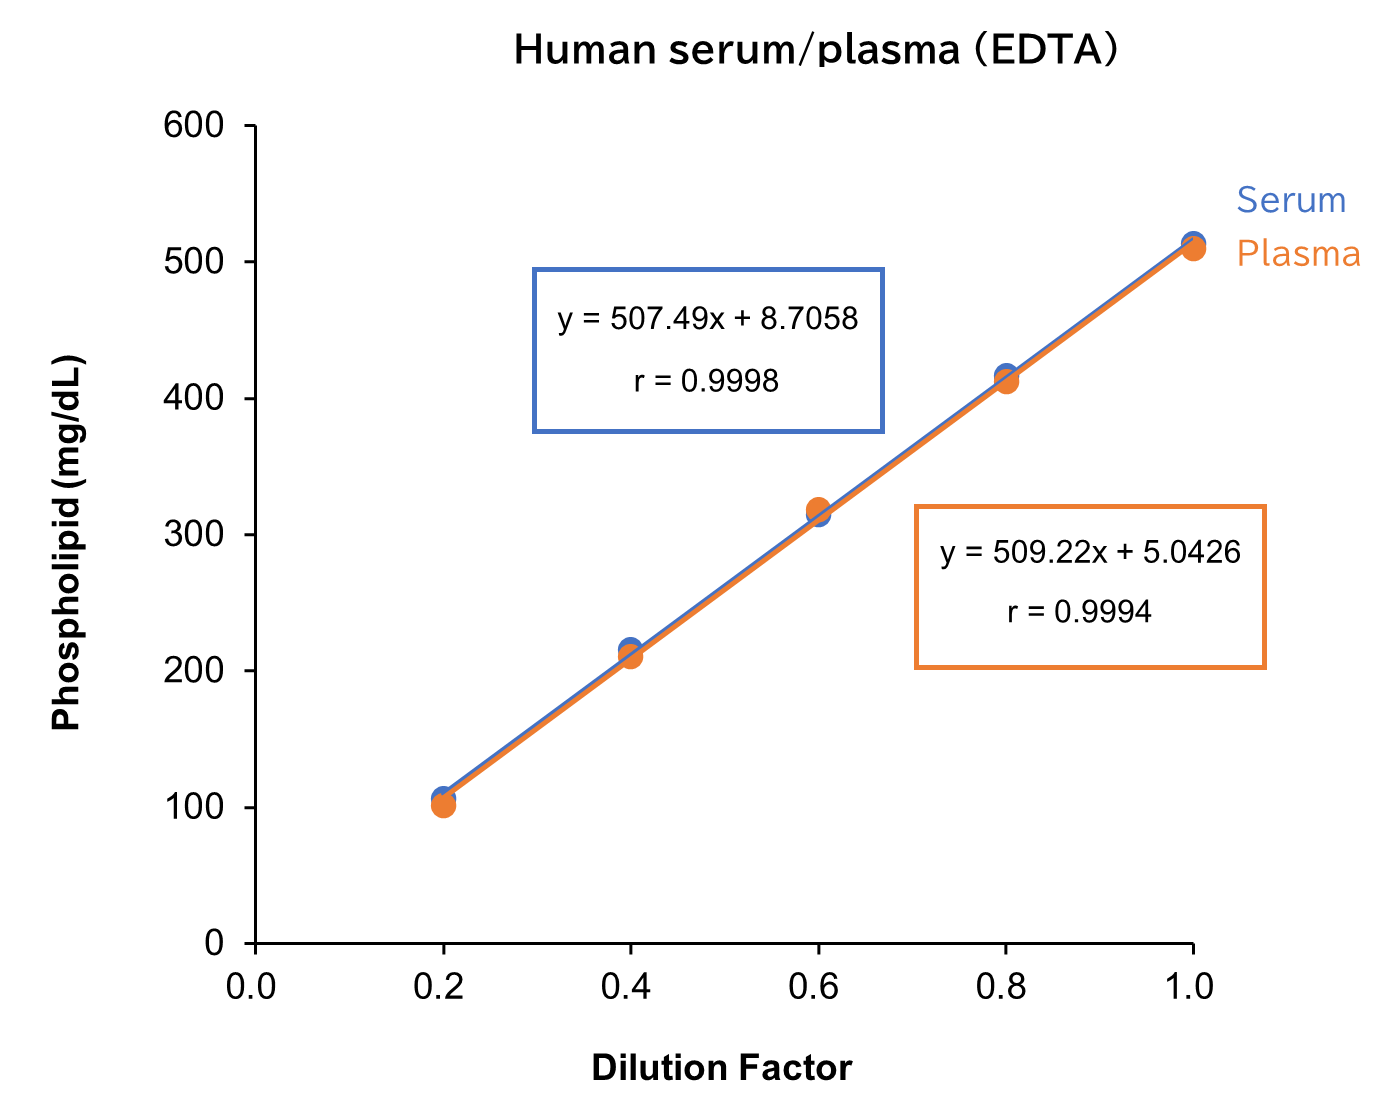
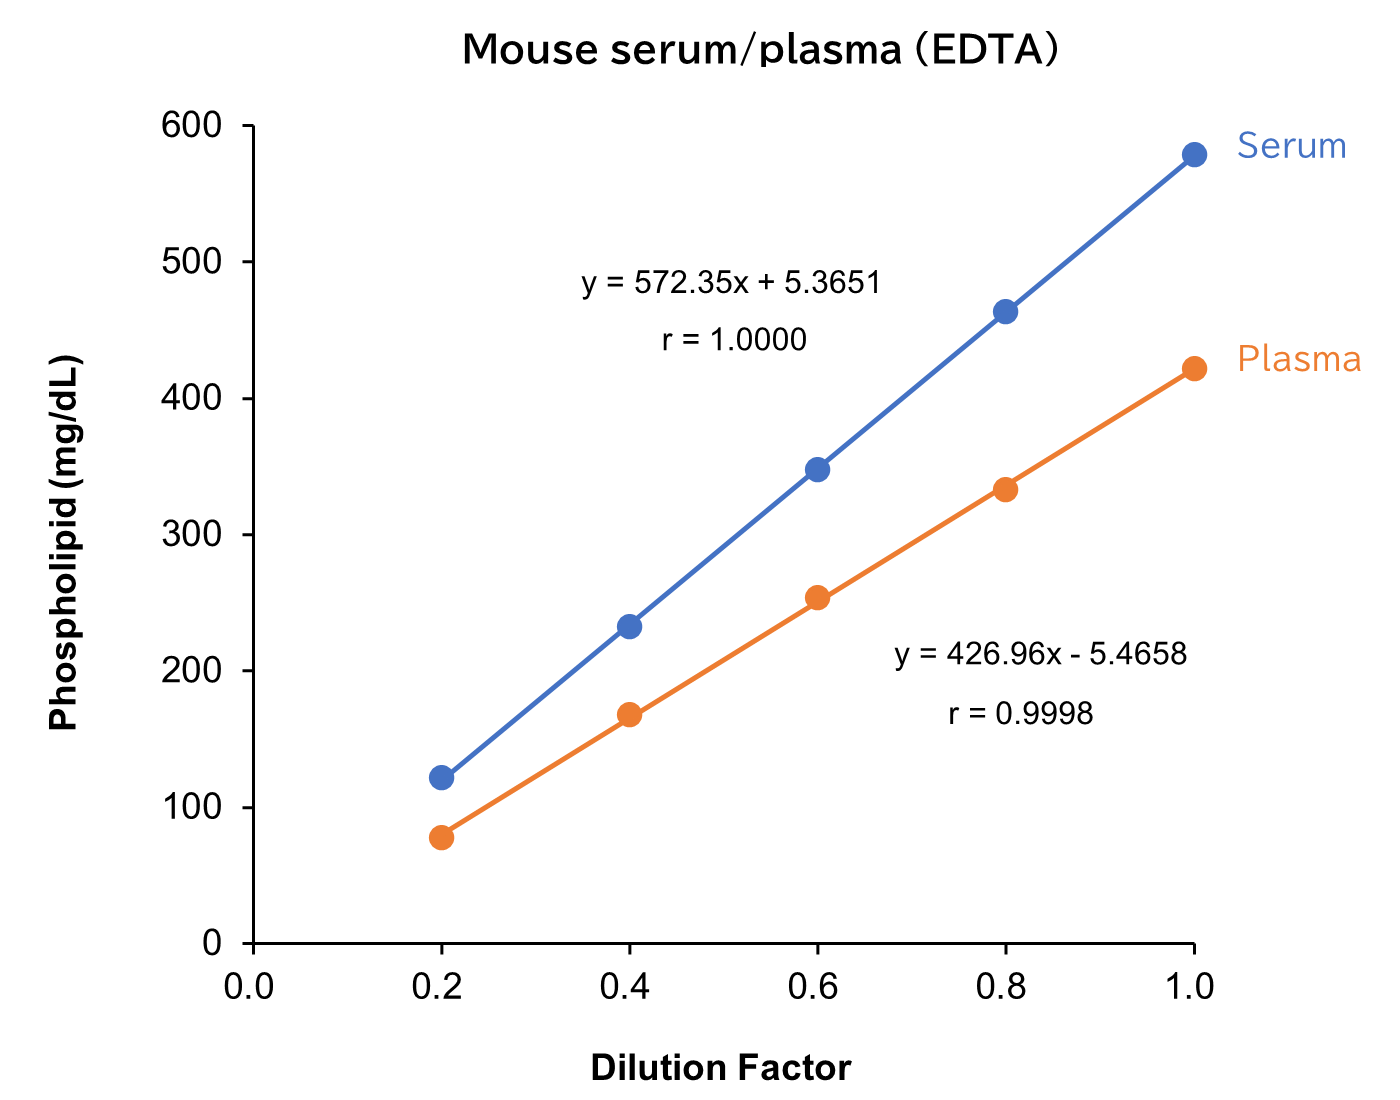
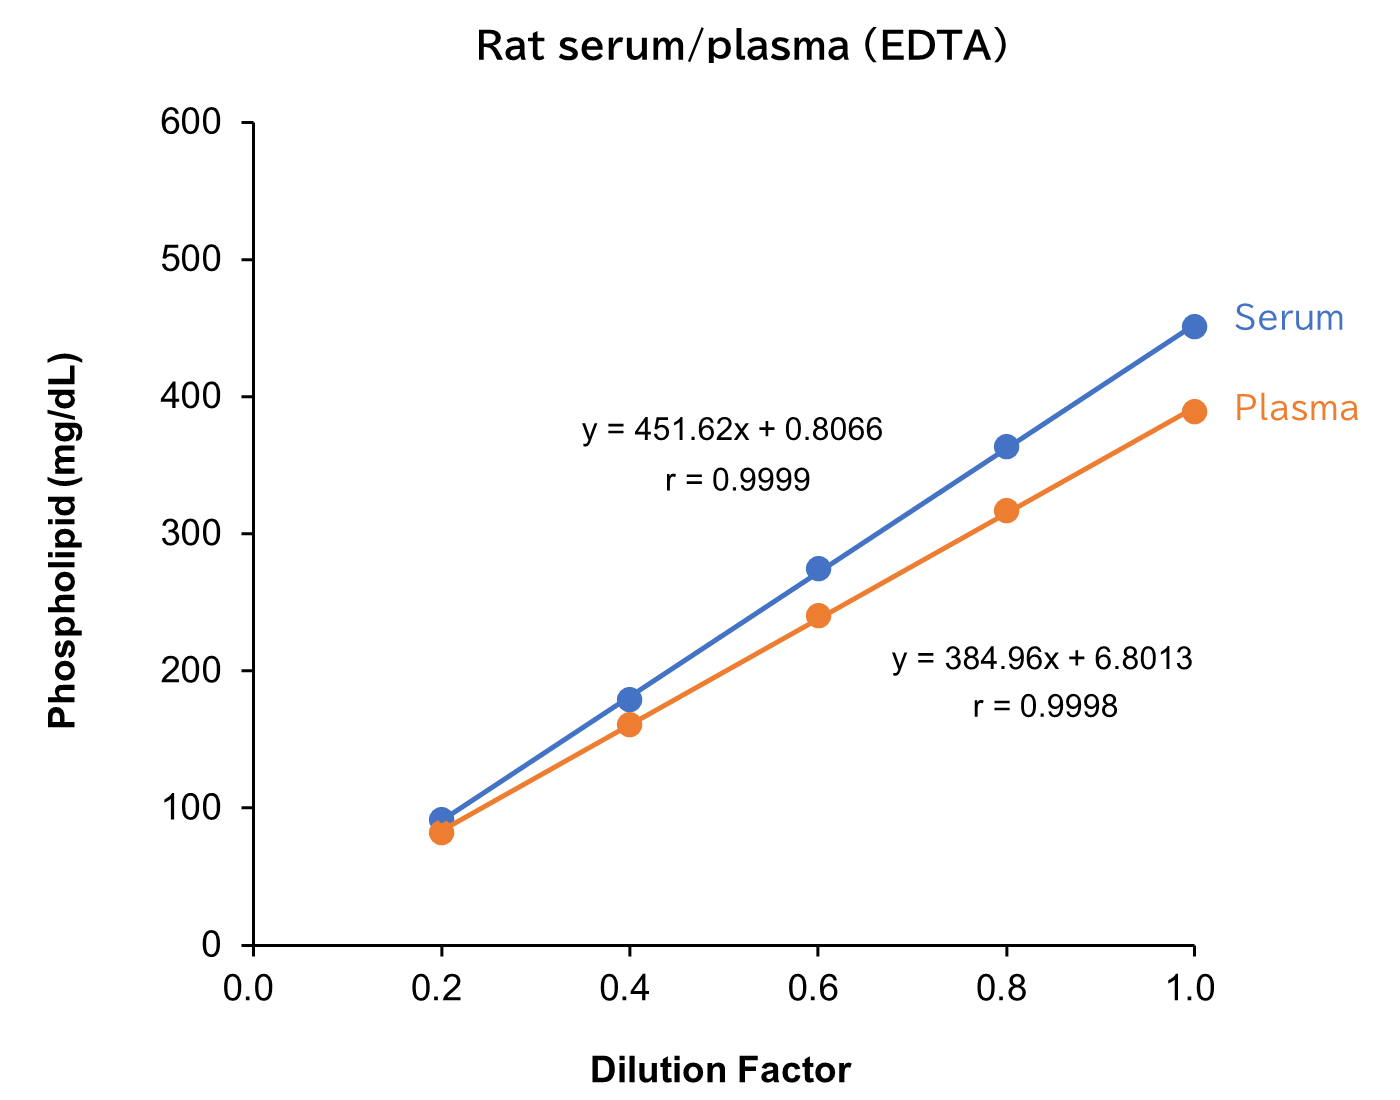
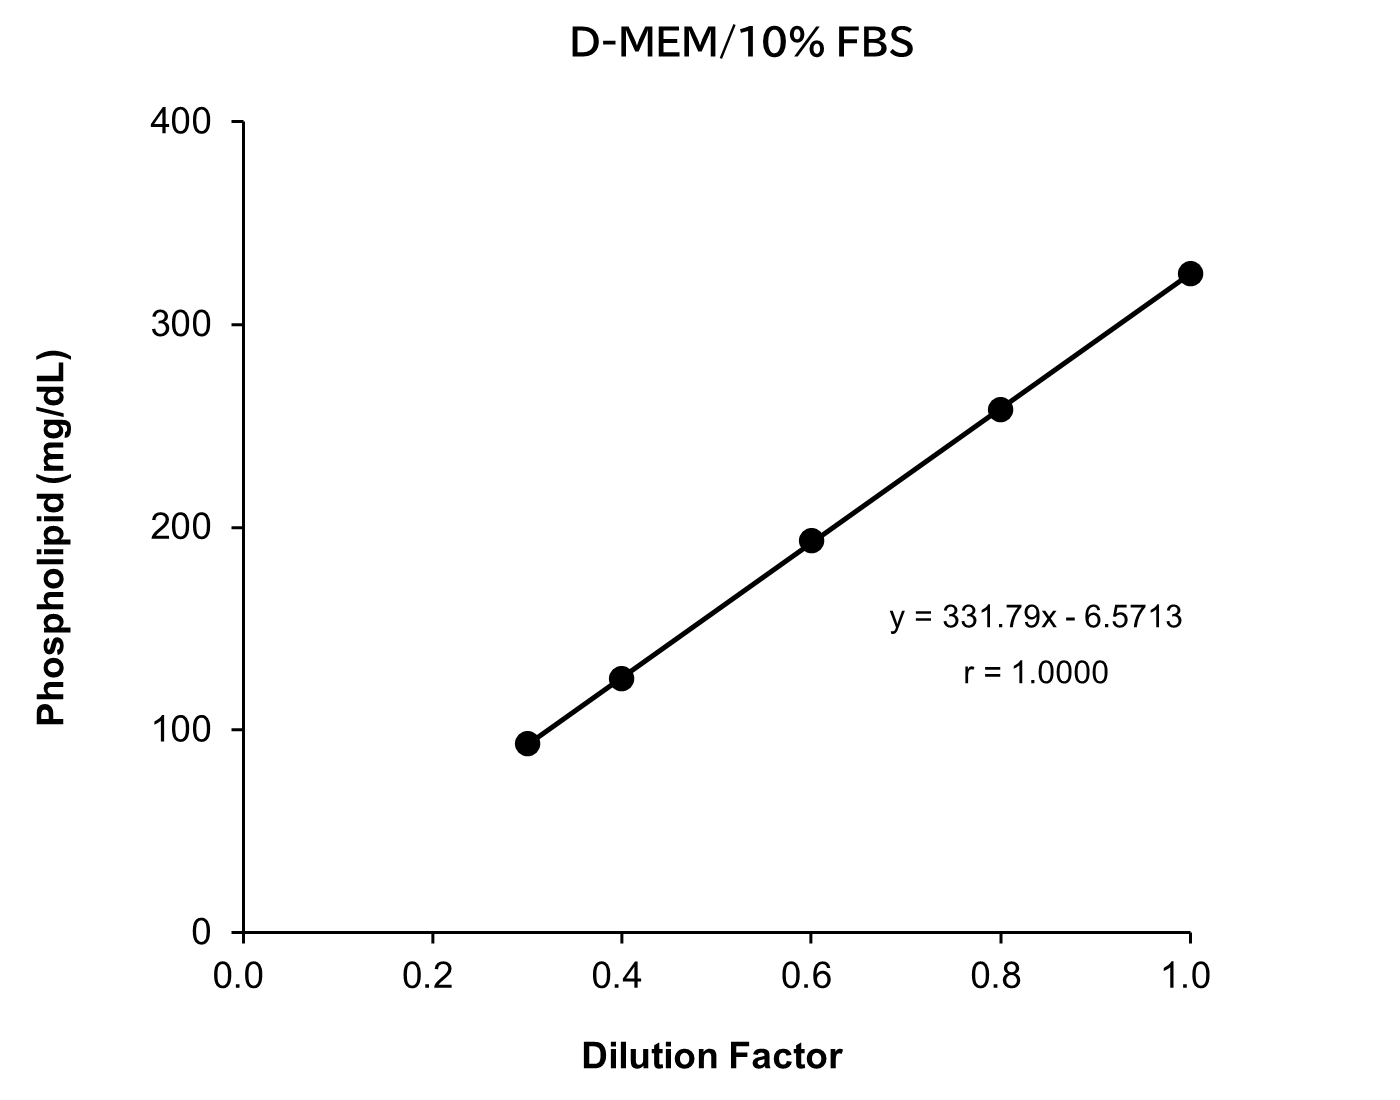
[Result]
All measurement results showed good linearity within the measurement range.
Spike and Recovery Test
Standard solutions at four concentrations were added to serum/plasma (EDTA) from human, mouse and rat. Next, spike recovery tests were conducted, with each measurement performed in duplicate.
Human sample
| Spiked amount (mg/dL) |
Measurement value (mg/dL) |
Recovery volume (mg/dL) |
Recovery rate (%) |
|
|---|---|---|---|---|
| Serum | - | 216.6 | - | |
| 152.4 | 361.6 | 145.0 | 95.1 | |
| 204.2 | 412.4 | 195.8 | 95.9 | |
| 262.3 | 462.8 | 246.2 | 93.9 | |
| 314.2 | 521.9 | 305.3 | 97.2 | |
| Average | 95.5 | |||
| Plasma (EDTA) |
- | 216.5 | - | |
| 152.4 | 359.7 | 143.2 | 94.0 | |
| 204.2 | 403.5 | 187.0 | 91.6 | |
| 262.3 | 466.6 | 250.1 | 95.3 | |
| 314.2 | 533.5 | 317.0 | 101 | |
| Average | 95.4 | |||
Mouse sample
| Spiked amount (mg/dL) |
Measurement value (mg/dL) |
Recovery volume (mg/dL) |
Recovery rate (%) |
|
|---|---|---|---|---|
| Serum | - | 285.3 | - | |
| 152.4 | 438.1 | 152.8 | 100 | |
| 204.2 | 486.6 | 201.3 | 98.6 | |
| 262.3 | 532.0 | 246.7 | 94.1 | |
| 314.2 | 601.3 | 316.0 | 101 | |
| Average | 98.4 | |||
| Plasma (EDTA) |
- | 111.5 | - | |
| 152.4 | 256.5 | 145.0 | 95.1 | |
| 204.2 | 311.2 | 199.7 | 97.8 | |
| 262.3 | 368.5 | 257.0 | 98.0 | |
| 314.2 | 432.7 | 321.1 | 102 | |
| Average | 98.3 | |||
Rat sample
| Spiked amount (mg/dL) |
Measurement value (mg/dL) |
Recovery volume (mg/dL) |
Recovery rate (%) |
|
|---|---|---|---|---|
| Serum | - | 138.1 | - | |
| 152.4 | 291.0 | 152.9 | 100 | |
| 204.2 | 345.1 | 207.0 | 101 | |
| 262.3 | 395.4 | 257.3 | 98.1 | |
| 314.2 | 459.7 | 321.6 | 102 | |
| Average | 101 | |||
| Plasma (EDTA) |
- | 97.8 | - | |
| 152.4 | 246.3 | 148.5 | 97.4 | |
| 204.2 | 298.6 | 200.8 | 98.3 | |
| 262.3 | 352.3 | 254.5 | 97.0 | |
| 314.2 | 422.5 | 324.7 | 103 | |
| Average | 99.0 | |||
[Result]
Good recovery rates were confirmed.
Measurement Using Actual Samples
Human sample
| ID\n | Measurement value (mg/dL) |
mean | SD | CV (%) |
||
|---|---|---|---|---|---|---|
| 1 | 2 | |||||
| Serum | ID1 | 240.0 | 223.9 | 232.0 | 11.38 | 4.9 |
| Plasma | ID1 | 211.0 | 212.6 | 211.8 | 1.131 | 0.5 |
Rat sample (S.D. rat)
| ID\n | Measurement value (mg/dL) |
mean | SD | CV (%) |
||
|---|---|---|---|---|---|---|
| 1 | 2 | |||||
| Serum | ID1 | 137.6 | 131.5 | 134.6 | 4.313 | 3.2 |
| ID2 | 201.3 | 197.3 | 199.3 | 2.828 | 1.4 | |
| ID3 | 167.3 | 169.6 | 168.5 | 1.626 | 1.0 | |
| ID4 | 159.7 | 160.2 | 160.0 | 0.3536 | 0.2 | |
| ID5 | 166.0 | 161.1 | 163.6 | 3.465 | 2.1 | |
| Plasma (EDTA) |
ID1 | 99.00 | 96.40 | 97.70 | 1.838 | 1.9 |
| ID2 | 126.9 | 118.7 | 122.8 | 5.798 | 4.7 | |
| ID3 | 109.5 | 106.2 | 107.9 | 2.333 | 2.2 | |
| ID4 | 121.3 | 110.7 | 116.0 | 7.495 | 6.5 | |
| ID5 | 129.3 | 113.9 | 121.6 | 10.89 | 9.0 | |
Mouse sample (CD-1(ICR))
| ID\n | Measurement value (mg/dL) |
mean | SD | CV (%) |
||
|---|---|---|---|---|---|---|
| 1 | 2 | |||||
| Serum | ID1 | 242.1 | 239.8 | 241.0 | 1.626 | 0.7 |
| ID2 | 213.6 | 214.2 | 213.9 | 0.4243 | 0.2 | |
| ID3 | 185.5 | 180.8 | 183.2 | 3.323 | 1.8 | |
| ID4 | 201.5 | 194.7 | 198.1 | 4.808 | 2.4 | |
| ID5 | 166.8 | 175.3 | 171.1 | 6.010 | 3.5 | |
| Plasma (EDTA) |
ID1 | 108.2 | 114.5 | 111.4 | 4.455 | 4.0 |
| ID2 | 124.1 | 121.8 | 123.0 | 1.626 | 1.3 | |
| ID3 | 107.0 | 99.70 | 103.4 | 5.162 | 5.0 | |
| ID4 | 120.2 | 109.7 | 115.0 | 7.425 | 6.5 | |
| ID5 | 134.4 | 135.2 | 134.8 | 0.5657 | 0.4 | |
Dog sample (Beagle)
| ID\n | Measurement value (mg/dL) |
mean | SD | CV (%) |
||
|---|---|---|---|---|---|---|
| 1 | 2 | |||||
| Serum | ID1 | 365.7 | 381.0 | 373.4 | 10.82 | 2.9 |
| ID2 | 283.8 | 264.4 | 274.1 | 13.72 | 5.0 | |
| ID3 | 375.1 | 334.2 | 354.7 | 28.92 | 8.2 | |
| ID4 | 287.5 | 288.0 | 287.8 | 0.3536 | 0.1 | |
| ID5 | 459.9 | 484.8 | 472.4 | 17.61 | 3.7 | |
| ID6 | 300.2 | 306.3 | 303.3 | 4.313 | 1.4 | |
| ID7 | 271.8 | 278.4 | 275.1 | 4.667 | 1.7 | |
| ID8 | 276.4 | 279.3 | 277.9 | 2.051 | 0.7 | |
| Plasma (EDTA) |
ID1 | 340.4 | 316.2 | 328.3 | 17.11 | 5.2 |
| ID2 | 321.5 | 345.1 | 333.3 | 16.69 | 5.0 | |
| ID3 | 351.1 | 374.4 | 362.8 | 16.48 | 4.5 | |
| ID4 | 322.8 | 327.0 | 324.9 | 2.970 | 0.9 | |
| ID5 | 337.4 | 364.0 | 350.7 | 18.81 | 5.4 | |
| ID6 | 303.3 | 316.7 | 310.0 | 9.475 | 3.1 | |
| ID7 | 318.9 | 321.5 | 320.2 | 1.838 | 0.6 | |
| ID8 | 310.7 | 306.0 | 308.4 | 3.323 | 1.1 | |
Cat sample (Short hair)
| ID\n | Measurement value (mg/dL) |
mean | SD | CV (%) |
||
|---|---|---|---|---|---|---|
| 1 | 2 | |||||
| Serum | ID1 | 244.8 | 246.4 | 245.6 | 1.131 | 0.5 |
| ID2 | 193.7 | 188.3 | 191.0 | 3.818 | 2.0 | |
| ID3 | 236.3 | 240.1 | 238.2 | 2.687 | 1.1 | |
| ID4 | 229.7 | 229.9 | 229.8 | 0.1414 | 0.1 | |
| ID5 | 226.7 | 227.4 | 227.1 | 0.4950 | 0.2 | |
| ID6 | 239.8 | 236.2 | 238.0 | 2.546 | 1.1 | |
| ID7 | 305.3 | 299.4 | 302.4 | 4.172 | 1.4 | |
| ID8 | 159.6 | 157.6 | 158.6 | 1.414 | 0.9 | |
| Plasma (EDTA) |
ID1 | 214.5 | 212.0 | 213.3 | 1.768 | 0.8 |
| ID2 | 114.9 | 116.9 | 115.9 | 1.414 | 1.2 | |
| ID3 | 199.8 | 194.8 | 197.3 | 3.536 | 1.8 | |
| ID4 | 180.9 | 184.6 | 182.8 | 2.616 | 1.4 | |
| ID5 | 195.6 | 201.5 | 198.6 | 4.172 | 2.1 | |
| ID6 | 143.7 | 139.3 | 141.5 | 3.111 | 2.2 | |
| ID7 | 168.2 | 166.3 | 167.3 | 1.344 | 0.8 | |
| ID8 | 183.7 | 178.2 | 181.0 | 3.889 | 2.1 | |
FAQ
About sample
- Is there any influence from substances that interfere with measurement (ascorbic acid, bilirubin, etc.)?
- Hemolysis, ascorbic acid and bilirubin have almost no effect on the measured values.
About kit usage
- Which types of phospholipids can be measured with this kit?
- Among phospholipids, this method measures lecithin, sphingomyelin, and lysolecithin, but does not measure cephalin.
- What instruments, and equipment are required for the assay using this kit?
- The instruments and equipment required for the use of this kit are listed below.
- 96 well microplate (transparent type)
- Micropipette
- Plate mixer*
- Incubator maintaining at 37°C*
- Microplate reader with 600 nm wavelength filter
(*This is not necessary depending on the model of the microplate reader. )
(For test tube method)
- Test tube or microtube
- Pipette
- Incubator maintaining at 37°C
- Spectrophotometer or colorimeter with a 600 nm wavelength filter
- What are the storage conditions and shelf-life guidelines for each reagent?
- Chromogen Substrate
Dissolve 1 vial of Chromogen Substrate with 50 mL of Buffer Solution. After reconstitution, the solution should be stored at 2°C-10°C and used within one week.
Manufacturer Information
Alias
- LabAssay
639-51001 (Previous code)
LABPLIP-M1 (Previous code)
296-63801 (Previous code)
For research use or further manufacturing use only. Not for use in diagnostic procedures.
Product content may differ from the actual image due to minor specification changes etc.
If the revision of product standards and packaging standards has been made, there is a case where the actual product specifications and images are different.
The prices are list prices in Japan.Please contact your local distributor for your retail price in your region.