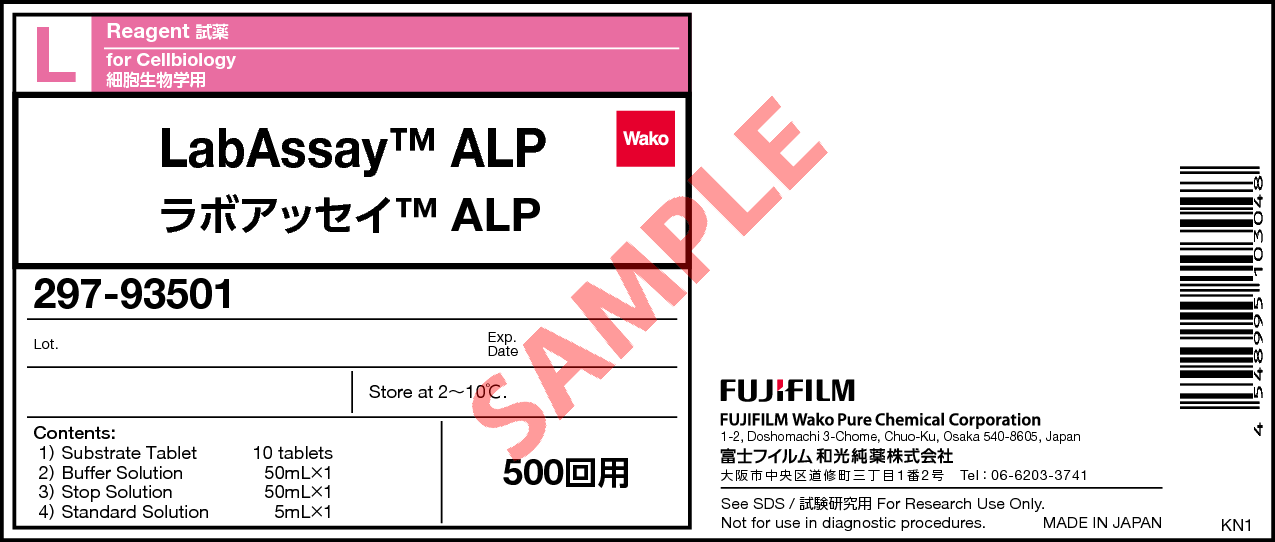
LabAssay™ ALP
- for Cellbiology
- Manufacturer :
- FUJIFILM Wako Pure Chemical Corporation
- Storage Condition :
- Keep at 2-10 degrees C.
-
 Close
Close -
 Close
Close
- Structural Formula
- Label
- Packing
- SDS
|
Comparison
|
Product Number
|
Package Size
|
Price
|
Inventory
|
|
|---|---|---|---|---|---|
|
|
|
500Tests
|
|
In stock in Japan |
Please check here for notes on products and prices.
Document
Kit component
For 500 tests
| Substrate Tablet | 10 tablets |
|---|---|
| Buffer Solution | 50 mL/1 bottle |
| Stop Solution | 50 mL/1 bottle |
| Standard Solution | 5 mL/1 bottle |
Product Overview
Alkaline Phosphatase (ALP) is distributed in a variety of tissues such as liver, bone, and small intestine in animals. The change of the enzyme activity in tissues is an important hallmark for physiological phenomena as osteogenesis and so on. This kit is for Alkaline Phosphatase assay in a simultaneous multi-sample assay format with a microplate using p-Nitrophenylphosphate as a substrate.
Kit Performance
| Analysis sample | Human Serum Mouse Serum Rat Serum Dog Serum Cat Serum Culture medium (D-MEM)* |
|---|---|
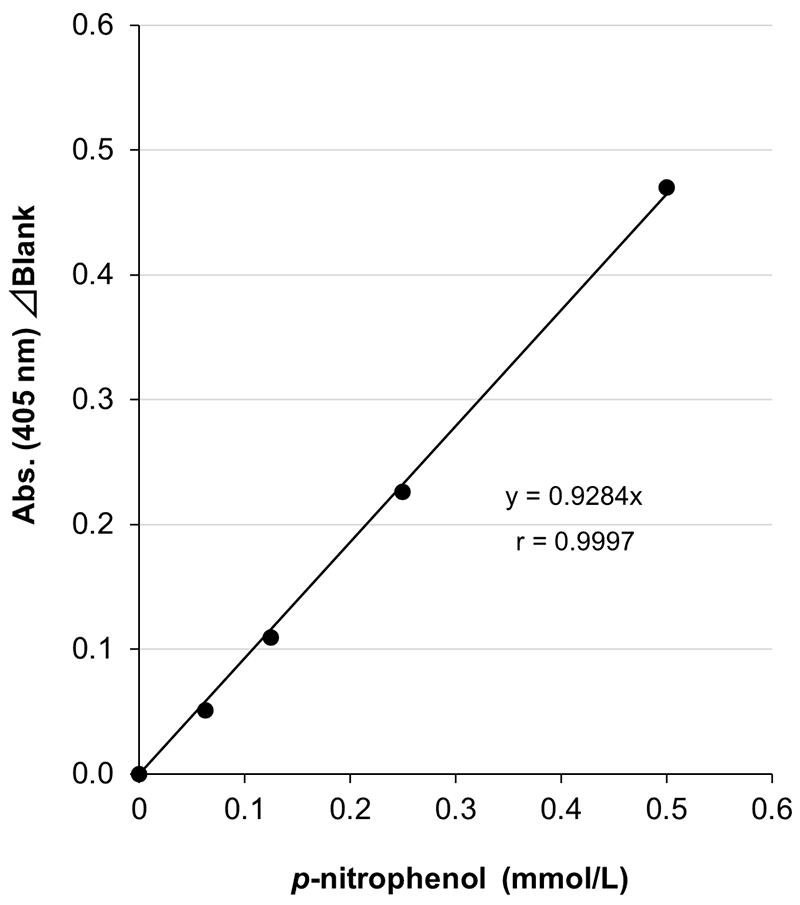
| Calibration curve range | 0.0625-0.5 mmol/L *p-nitrophenol |
| Sample volume | 20 μL |
| Measurement duration | Approx. 20 min |
| Wavelength | 405 nm |
Measurement availability depends on the culture medium, cell type and culture conditions. Please perform a spiked recovery test or dilution linearity test in advance using the culture medium to be used in your experiment.
Example of Calibration Curve
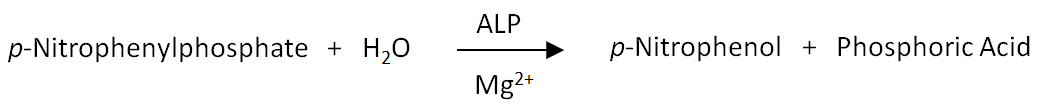
Assay Principle
p-Nitrophenylphosphate is hydrolyzed into p-Nitrophenol and Phosphoric Acid in the carbonate buffer (pH 9.8) in the presence of Alkaline Phosphatase in sample. Released p-Nitrophenol showing yellow color is optically measured at 405 nm wavelength as the enzyme activity.
Procedure
Perform the assay in the wells according to the following table scheme.
| Test | Standard | Blank | |
|---|---|---|---|
| Working Assay Solution | 100 μL | 100 μL | 100 μL |
| Sample | Sample 20 μL | Dilution series 20 μL | Distilled water 20 μL |
| Shake for 1 minute by plate mixer and incubate for 15 minutes at 37 ℃ | |||
| Stop Solution | 80 μL | 80 μL | 80 μL |
| Shake for 1 minute by plate mixer and measure the absorbance at 405 nm of wavelength using microplate reader. | |||
Data
Repeatability (within run precision)
Repeatability was conducted by measuring sixfold assays of serum samples from human, mouse, rat at two concentrations with this product.
| n\ID | Human serum | Mouse serum | Rat serum | |||
|---|---|---|---|---|---|---|
| ID1 (mmol/L) | ID2 (mmol/L) | ID1 (mmol/L) | ID2 (mmol/L) | ID1 (mmol/L) | ID2 (mmol/L) | |
| 1 | 0.768 | 0.383 | 0.503 | 0.269 | 0.568 | 0.325 |
| 2 | 0.761 | 0.368 | 0.490 | 0.268 | 0.580 | 0.324 |
| 3 | 0.746 | 0.367 | 0.508 | 0.263 | 0.571 | 0.311 |
| 4 | 0.753 | 0.378 | 0.485 | 0.280 | 0.568 | 0.332 |
| 5 | 0.739 | 0.370 | 0.522 | 0.264 | 0.578 | 0.332 |
| 6 | 0.738 | 0.386 | 0.507 | 0.281 | 0.580 | 0.333 |
| mean | 0.751 | 0.375 | 0.503 | 0.271 | 0.574 | 0.326 |
| SD | 0.0121 | 0.00814 | 0.0134 | 0.00783 | 0.00581 | 0.00838 |
| CV(%) | 1.6 | 2.2 | 2.7 | 2.9 | 1.0 | 2.6 |
[Result]
The CV (%) of human serum was 1.6-2.2%, mouse serum was 2.7-2.9% and rat serum was 1.0-2.6%, indicating good repeatability.
Reproducibility (between run precision)
Reproducibility was conducted by measuring serum samples from human, mouse, rat at three concentrations each for four days with this product.
| Day\ID | Human serum | Mouse serum | Rat serum | ||||||
|---|---|---|---|---|---|---|---|---|---|
| ID3 (mmol/L) | ID4 (mmol/L) | ID5 (mmol/L) | ID3 (mmol/L) | ID4 (mmol/L) | ID5 (mmol/L) | ID3 (mmol/L) | ID4 (mmol/L) | ID5 (mmol/L) | |
| 1 | 0.735 | 0.494 | 0.359 | 0.489 | 0.380 | 0.254 | 0.565 | 0.436 | 0.325 |
| 2 | 0.734 | 0.489 | 0.367 | 0.490 | 0.369 | 0.240 | 0.544 | 0.433 | 0.318 |
| 3 | 0.733 | 0.504 | 0.367 | 0.505 | 0.387 | 0.263 | 0.601 | 0.478 | 0.352 |
| 4 | 0.717 | 0.490 | 0.350 | 0.489 | 0.372 | 0.234 | 0.571 | 0.435 | 0.323 |
| mean | 0.730 | 0.494 | 0.361 | 0.493 | 0.377 | 0.248 | 0.570 | 0.446 | 0.330 |
| SD | 0.00854 | 0.00685 | 0.00810 | 0.00785 | 0.00812 | 0.0132 | 0.0235 | 0.0217 | 0.0153 |
| CV(%) | 1.2 | 1.4 | 2.2 | 1.6 | 2.2 | 5.3 | 4.1 | 4.9 | 4.6 |
[Result]
The CV (%) of human serum was 1.2-2.2%, mouse serum was 1.6-5.3% and rat serum was 4.1-4.9%, indicating good reproducibility.
Dilution Linearity Test
Serum from human, mouse and rat, as well as D-MEM containing 10% FBS spiked with the standard, were serially diluted twofold with saline and measured in duplicate to assess linearity.
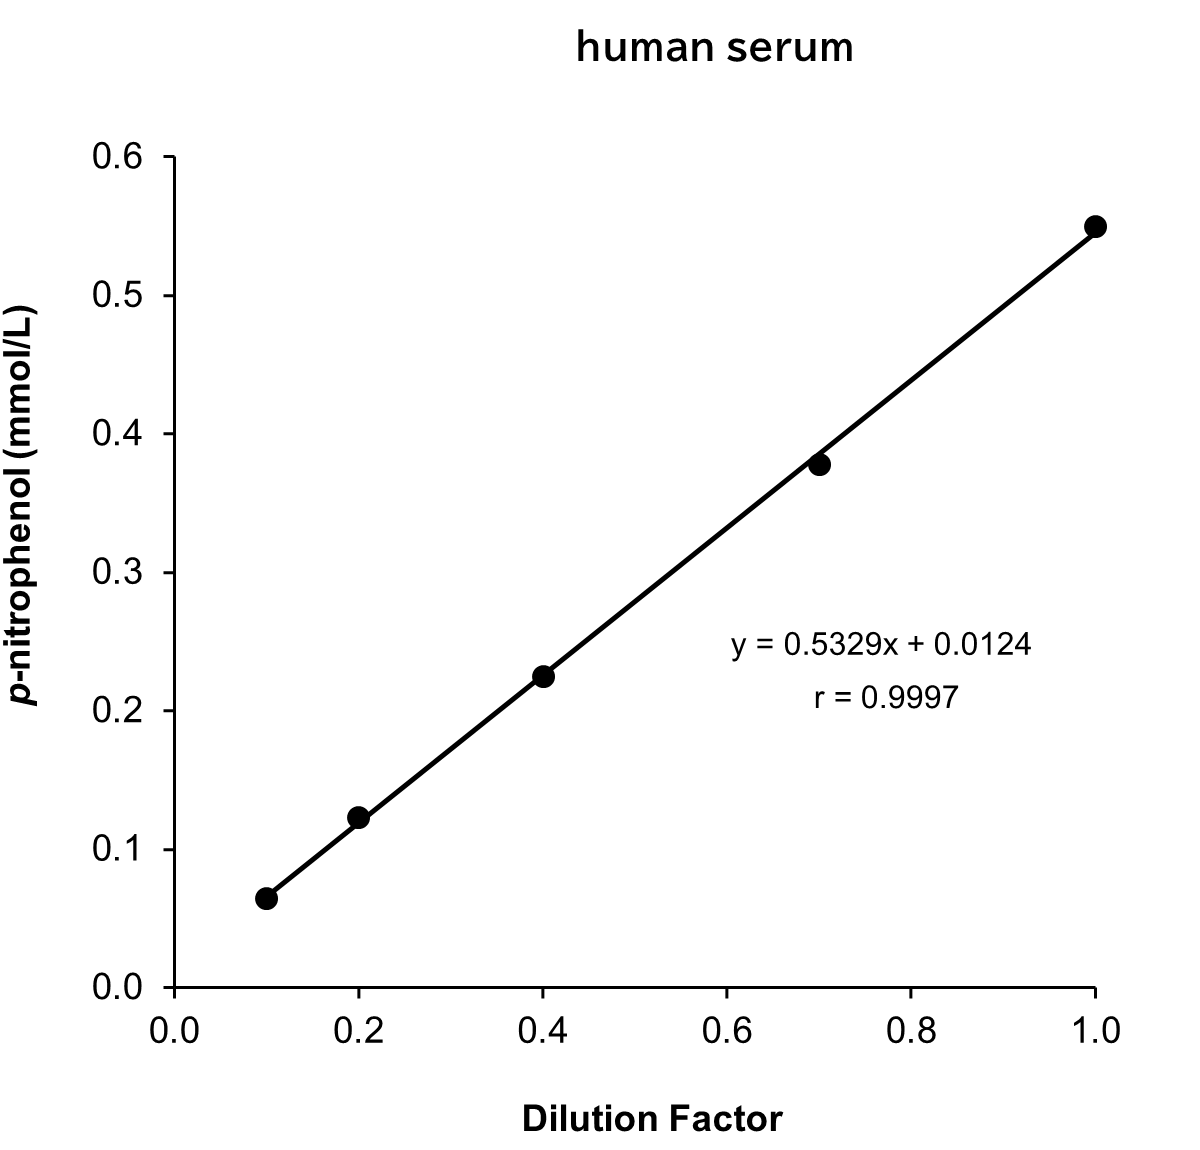
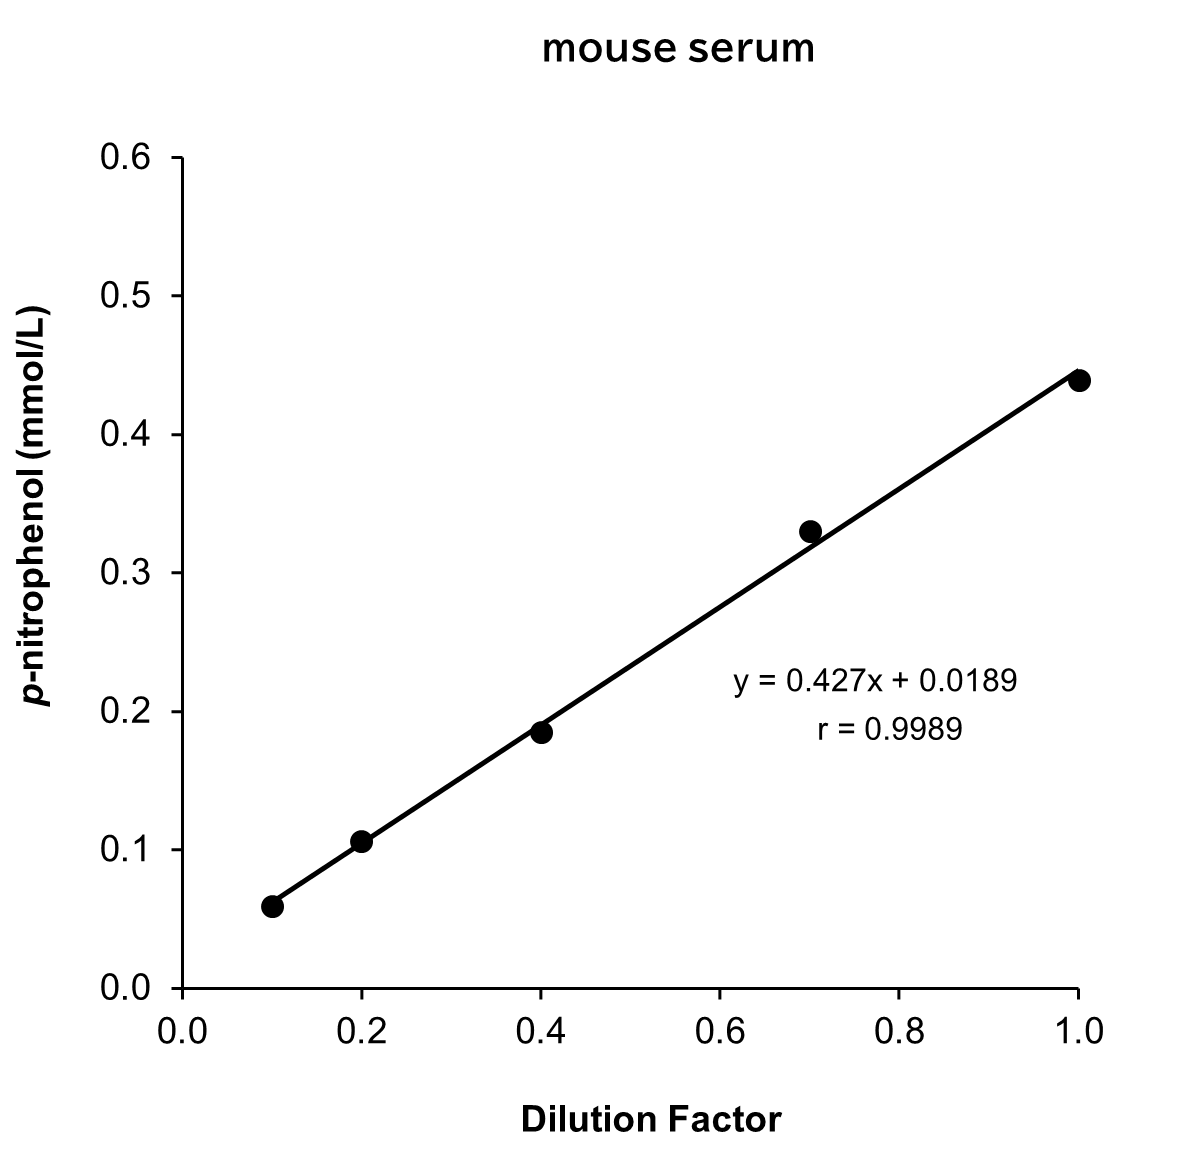
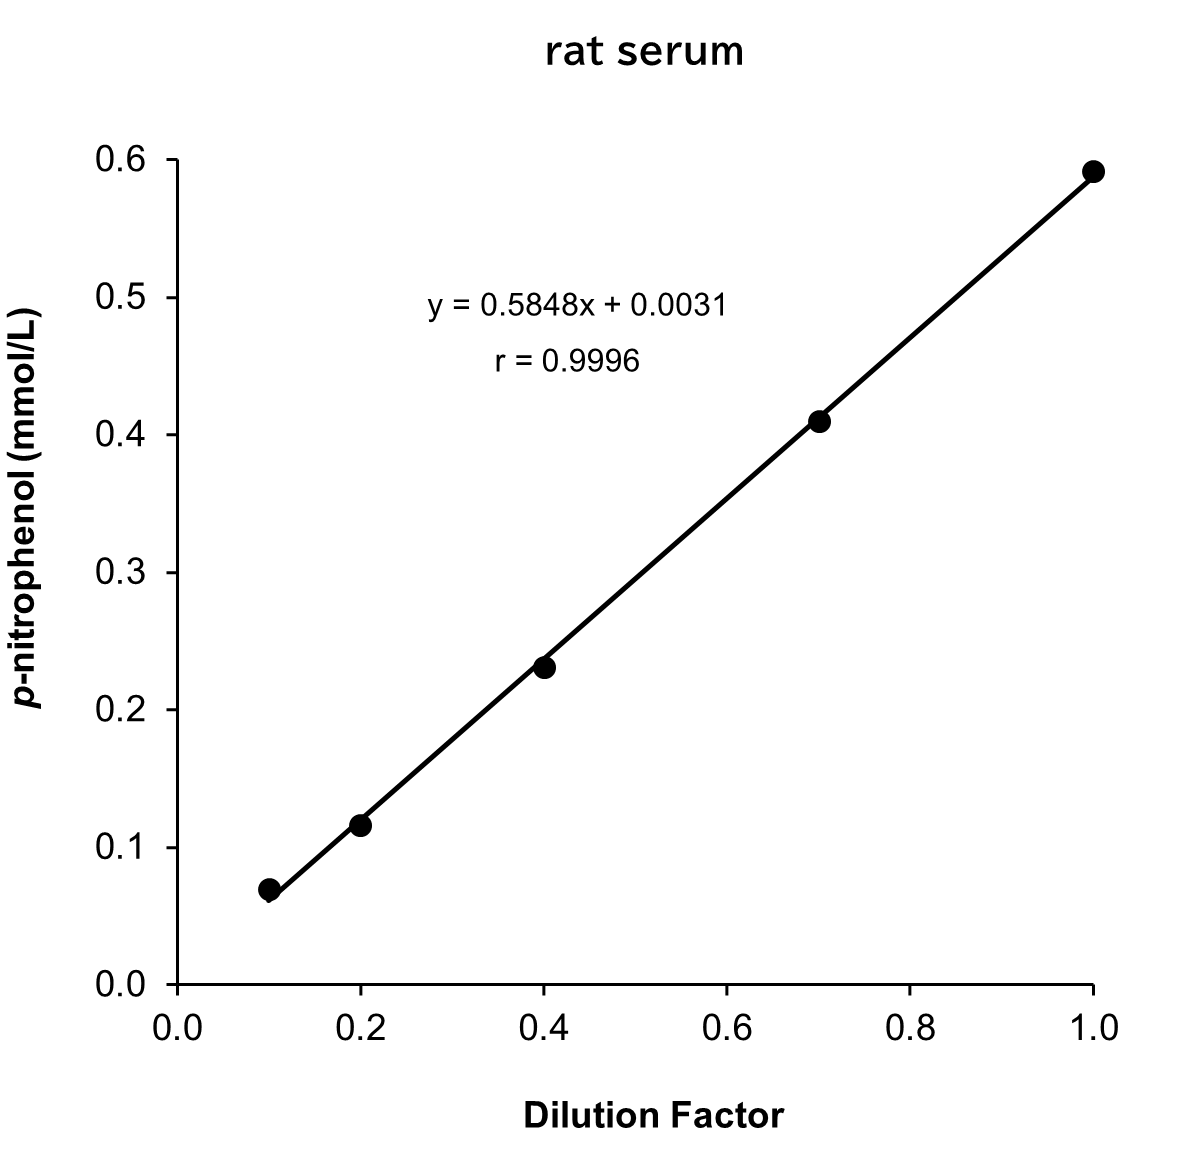
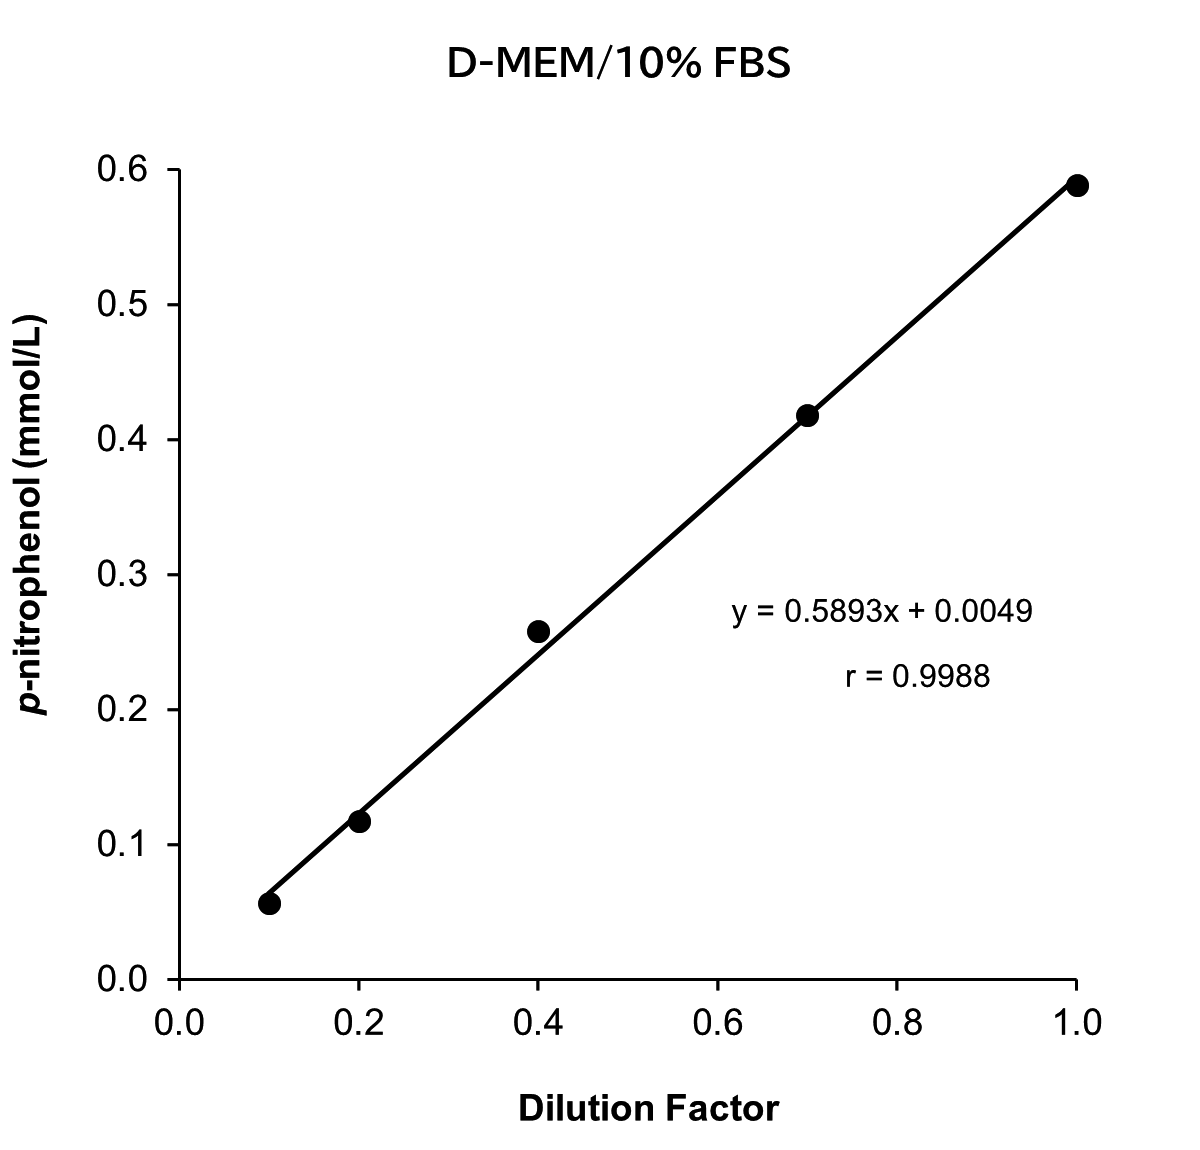
[Result]
All measurement results showed good linearity within the measurement range.
Spike and Recovery Test
Standard solutions at four concentrations were added to serum from human, mouse and rat. Next, spike recovery tests were conducted, with each measurement performed in duplicate.
Human sample
| Spiked amount (mmol/L) |
Measurement value (mmol/L) |
Recovery volume (mmol/L) |
Recovery rate (%) |
|
|---|---|---|---|---|
| Serum | - | 0.429 | - | - |
| 0.0970 | 0.527 | 0.0980 | 101 | |
| 0.197 | 0.587 | 0.158 | 80.2 | |
| 0.297 | 0.672 | 0.243 | 81.8 | |
| 0.507 | 0.866 | 0.437 | 86.2 | |
| Average | 87.3 | |||
Mouse sample
| Spiked amount (mmol/L) |
Measurement value (mmol/L) |
Recovery volume (mmol/L) |
Recovery rate (%) |
|
|---|---|---|---|---|
| Serum | - | 0.284 | - | - |
| 0.0600 | 0.343 | 0.0590 | 98.3 | |
| 0.127 | 0.399 | 0.115 | 90.6 | |
| 0.251 | 0.507 | 0.223 | 88.8 | |
| 0.500 | 0.753 | 0.469 | 93.8 | |
| Average | 92.9 | |||
Rat sample
| Spiked amount (mmol/L) |
Measurement value (mmol/L) |
Recovery volume (mmol/L) |
Recovery rate (%) |
|
|---|---|---|---|---|
| Serum | - | 0.374 | - | - |
| 0.0600 | 0.439 | 0.0650 | 108 | |
| 0.127 | 0.483 | 0.109 | 85.8 | |
| 0.251 | 0.598 | 0.224 | 89.2 | |
| 0.500 | 0.855 | 0.481 | 96.2 | |
| Average | 94.9 | |||
[Result]
Good recovery rates were confirmed.
Measurement Using Actual Samples
Human sample
| ID\n | Measurement value (mmol/L) |
mean | SD | CV (%) |
||
|---|---|---|---|---|---|---|
| 1 | 2 | |||||
| Serum | ID1 | 0.558 | 0.555 | 0.557 | 0.00212 | 0.4 |
Rat sample (S.D. rat)
| ID\n | Measurement value (mmol/L) |
mean | SD | CV (%) |
||
|---|---|---|---|---|---|---|
| 1 | 2 | |||||
| Serum | ID1 | 0.541 | 0.534 | 0.538 | 0.00495 | 0.9 |
| ID2 | 0.434 | 0.448 | 0.441 | 0.00990 | 2.2 | |
| ID3 | 0.357 | 0.357 | 0.357 | 0.00 | 0.0 | |
| ID4 | 0.461 | 0.458 | 0.460 | 0.00212 | 0.5 | |
| ID5 | 0.308 | 0.293 | 0.301 | 0.0106 | 3.5 | |
Mouse sample (CD-1(ICR))
| ID\n | Measurement value (mmol/L) |
mean | SD | CV (%) |
||
|---|---|---|---|---|---|---|
| 1 | 2 | |||||
| Serum | ID1 | 0.320 | 0.301 | 0.311 | 0.0134 | 4.3 |
| ID2 | 0.452 | 0.454 | 0.453 | 0.00141 | 0.3 | |
| ID3 | 0.505 | 0.484 | 0.495 | 0.0148 | 3.0 | |
| ID4 | 0.433 | 0.451 | 0.442 | 0.0127 | 2.9 | |
| ID5 | 0.372 | 0.375 | 0.374 | 0.00212 | 0.6 | |
Dog sample (Beagle)
| ID\n | Measurement value (mmol/L) |
mean | SD | CV (%) |
||
|---|---|---|---|---|---|---|
| 1 | 2 | |||||
| Serum | ID1 | 0.395 | 0.385 | 0.390 | 0.00707 | 1.8 |
| ID2 | 0.138 | 0.138 | 0.138 | 0.00 | 0.0 | |
| ID3 | 0.314 | 0.303 | 0.309 | 0.00778 | 2.5 | |
| ID4 | 0.323 | 0.299 | 0.311 | 0.0170 | 5.5 | |
| ID5 | 0.323 | 0.326 | 0.325 | 0.00212 | 0.7 | |
| ID6 | 0.297 | 0.290 | 0.294 | 0.00495 | 1.7 | |
| ID7 | 0.535 | 0.535 | 0.535 | 0.00 | 0.0 | |
| ID8 | 0.297 | 0.295 | 0.296 | 0.00141 | 0.5 | |
Cat sample (Short hair)
| ID\n | Measurement value (mmol/L) |
mean | SD | CV (%) |
||
|---|---|---|---|---|---|---|
| 1 | 2 | |||||
| Serum | ID1 | 0.204 | 0.196 | 0.200 | 0.00566 | 2.8 |
| ID2 | 0.158 | 0.165 | 0.162 | 0.00495 | 3.1 | |
| ID3 | 0.221 | 0.213 | 0.217 | 0.00566 | 2.6 | |
| ID4 | 0.229 | 0.234 | 0.232 | 0.00354 | 1.5 | |
| ID5 | 0.297 | 0.295 | 0.296 | 0.00141 | 0.5 | |
| ID6 | 0.155 | 0.149 | 0.152 | 0.00424 | 2.8 | |
| ID7 | 0.398 | 0.388 | 0.393 | 0.00707 | 1.8 | |
| ID8 | 0.343 | 0.333 | 0.338 | 0.00707 | 2.1 | |
FAQ
About calibration curve
- Are there any precautions to consider when generating the calibration curve?
- Even when distilled water is used as the sample, a background absorbance of approximately 0.3 OD is observed. Therefore, when measuring samples, we recommend subtracting the background OD value prior to generating the calibration curve. If the measured absorbance values differ significantly from the calibration curve shown, please review the following points.
- Ensure that no undissolved substrate tablet remains (allow the tablet to dissolve completely).
- Check the condition of the substrate solution (store refrigerated and protected from light; use within 2 weeks).
- Strictly adhere to the specified enzyme reaction temperature (37°C) and reaction time (15 minutes).
About sample
- What should I do with samples that exceed the measurable range?
- For samples exceeding the upper limit of the assay range, dilute the sample with distilled water or an appropriate buffer prior to measurement. Do not use phosphate-based buffers. Multiply the result by the dilution factor to obtain the final value.
- Is there any influence from substances that interfere with measurement (bilirubin, etc.)?
- Hemolysis and bilirubin have almost no effect on the measured values.
About kit usage
- What instruments, and equipment are required for the assay using this kit?
- The instruments and equipment required for the use of this kit are listed below.
- 96 well microplate (transparent type)
- Micropipette
- Pippette
- Test tube
- Plate mixer*
- Incubator maintaining at 37°C*
- Microplate reader with 405 nm wavelength filter
- What are the storage conditions and shelf-life guidelines for each reagent?
- Working Assay Solution
Dissolve a Substrate Tablet into 5 mL of Buffer for Substrate Tablet provided.
It can be stored for two weeks at 2-10°C in the dark after reconstitution.
Stop Solution
Ready-to-use. It can be stored at 2-10°C.
Dilution series of Standard Solution
Store unused standard products at 2–10°C.
Overview / Applications
Property
Manufacturer Information
Alias
- LabAssay
633-51021 (Previous code)
LABALP-M1 (Previous code)
291-58601 (Previous code)
For research use or further manufacturing use only. Not for use in diagnostic procedures.
Product content may differ from the actual image due to minor specification changes etc.
If the revision of product standards and packaging standards has been made, there is a case where the actual product specifications and images are different.
The prices are list prices in Japan.Please contact your local distributor for your retail price in your region.